
Agrivoltaics and drones: how to monitor agricultural production under solar panels
Agrivoltaics and drones: how to monitor agricultural production under solar panels
Introduction
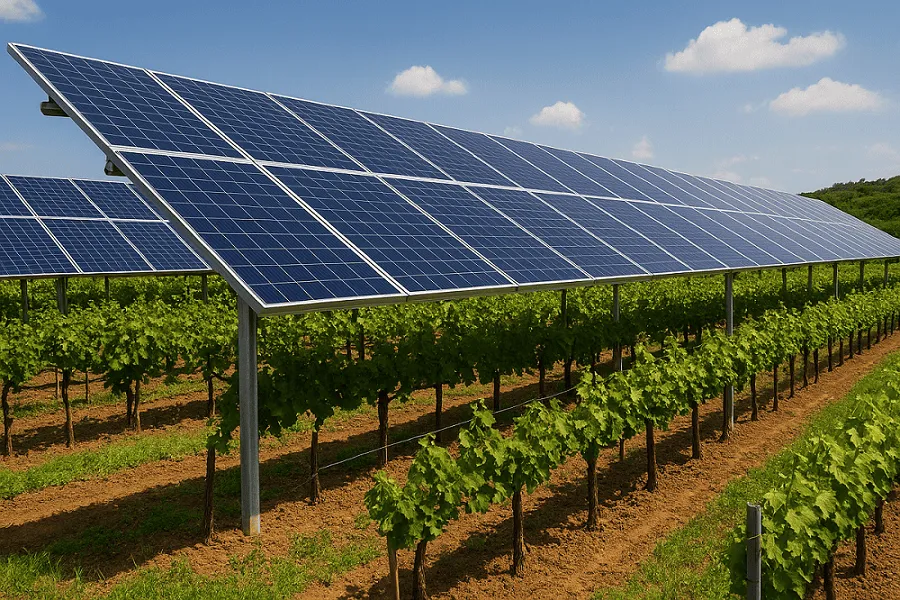
Agrivoltaics refers to the use of land for a dual purpose: producing photovoltaic energy, thanks to the installation of solar panels, and carrying out agricultural activity. The benefits of an agrivoltaic system vary depending on the crop chosen. For example, in the case of tomatoes, installing panels provides greater shading that reduces the negative effects of extreme temperatures; another example is rice, a crop that requires a lot of water and could benefit from shaded areas with a “cooling” effect.
This is an innovative solution that combines electricity production with agricultural production, which we could consider a win-win approach for the farmer. However, introducing partial solar panel coverage significantly alters the field’s microclimatic conditions: available solar radiation, soil temperature, humidity and water distribution.
To understand and optimise these effects, drones make it possible to collect highly precise data on the physiological state of crops and on the microclimatic variations generated by the presence of panels, thereby offering concrete support for agronomic decisions.
The drone: eyes in service of the technician and the farmer
A drone equipped with RGB sensors and a thermal camera is a decisive tool for thoroughly analysing the status of an agrivoltaic system (Figure 1). Through planned flights, iDrone is Agrobit’s service that makes it possible to acquire valuable information quickly and with high precision. The images collected during the flight are processed using dedicated software and algorithms developed by the team, producing thematic maps useful for monitoring both the tree crop and the energy system.
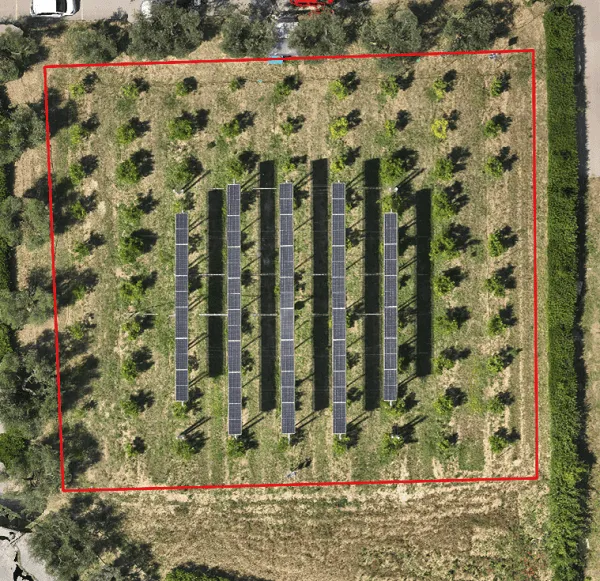
Fig.1: Citrus grove in an experimental agrivoltaic system (CIHEAM Bari).
Thanks to this approach, the farmer does not have to rely solely on observing the field “with the naked eye”, but can count on an objective, detailed analysis based on measurable data.
Specifically, iDrone makes it possible to:
- Monitor crop development under solar panels, assessing differences in vigour and growth between areas in full sun and shaded areas;
- Detect water or thermal stress early, essential in an agrivoltaic context where environmental conditions are heterogeneous;
- Create thematic maps that support targeted agronomic choices, such as irrigation and site-specific resource management.
RGB and thermal survey through the 3D model
The case study is a citrus grove grown in southern Italy, with a photovoltaic system present simultaneously on some rows. Specifically, the panels are mounted at a height of around 4 metres and cover the central area of the citrus grove. This preliminary information is essential for data analysis. As this is a tree crop system, it is essential to focus on correctly extracting data from the canopy. RGB images make it possible to create a true-colour orthomosaic from which the heterogeneity of the system can be appreciated, and, during the processing of the aerial images, the 3D point cloud, i.e. a digital twin, of the field is also built. Figure 2 shows a 3D perspective of the citrus grove, with excellent point depth, which is essential for assessments beneath the photovoltaic panels.
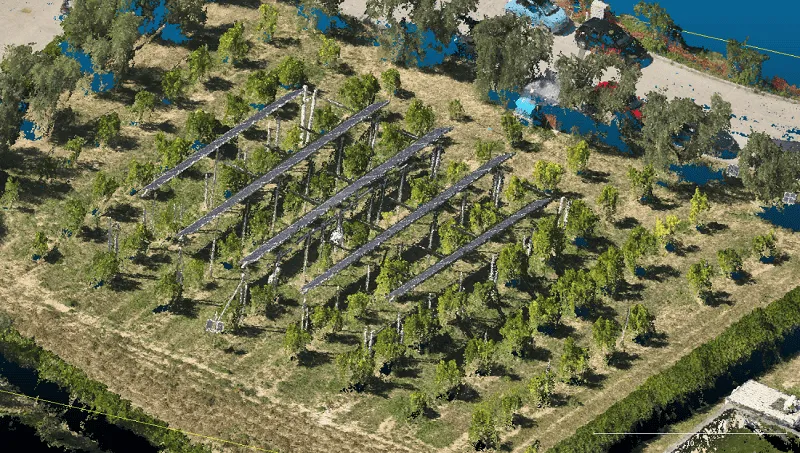
Fig.2: Three-dimensional model of the citrus grove.
Thanks to dedicated algorithms, it is possible to extract the vegetated canopy (Figure 3a) of each individual citrus tree and calculate its biometric parameters, including for plants located beneath the panels. Biometric data in agriculture refers to all measurable and quantifiable information regarding the physical, physiological or behavioural characteristics of plants, for example: density (Figure 3b), height and thickness (Figure 3c), and canopy volume (Figure 3d) from RGB images, and average temperature from thermal images (Figure 3e).
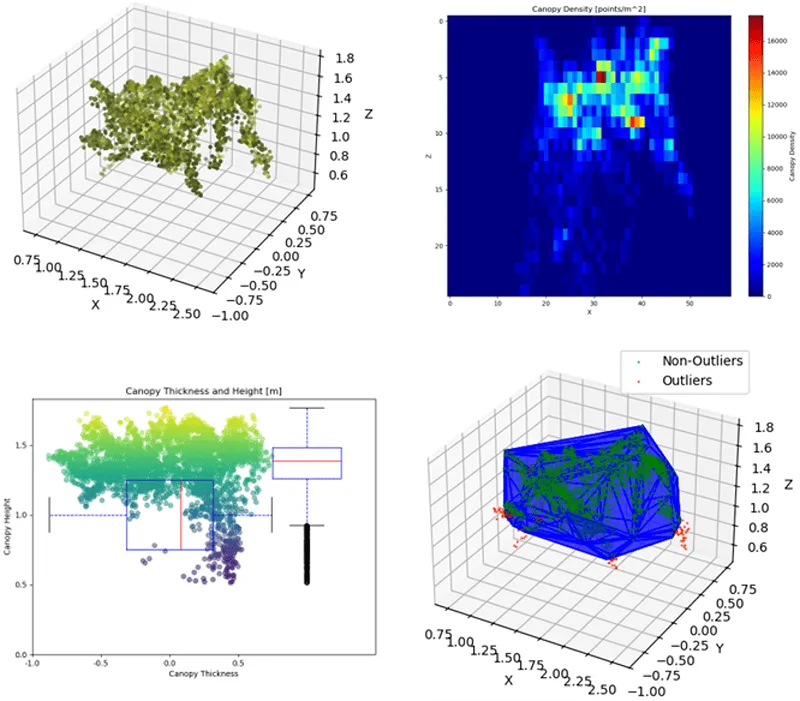
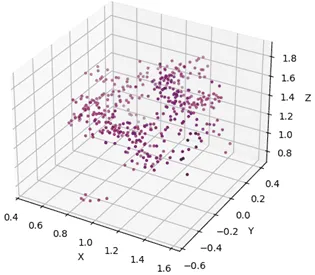
Fig.3: RGB 3D point cloud of the canopy (a), canopy density (b), canopy height and thickness (c), canopy volume (d), thermal 3D point cloud of the canopy (e).
By spatialising this data, extracted plant by plant in an automated way using computer vision and AI algorithms, it is possible to derive two indices in particular:
- TRV (Tree Row Volume): this represents canopy volume per hectare, i.e. it quantifies how much biomass is present in one hectare of the plot. Figure 4 shows the data for each individual plant from which the canopy was previously extracted. Thanks to data spatialisation techniques, it is possible to obtain a zoning map (Figure 5). The importance of this map lies in providing an overall picture of the field at a glance, and it forms the basis for developing prescription maps. The main purpose is to optimise input distribution and estimate vegetative density.
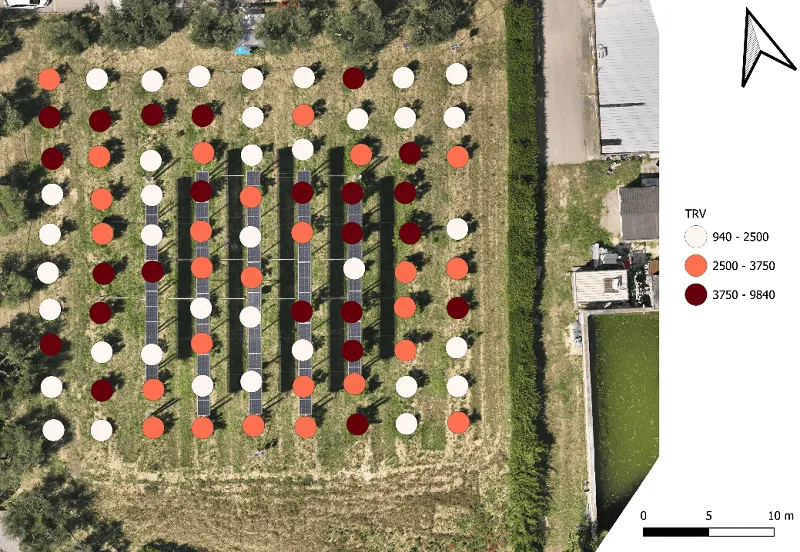
Fig.4: Point-by-point TRV (Tree Row Volume) analysis for individual citrus plants.
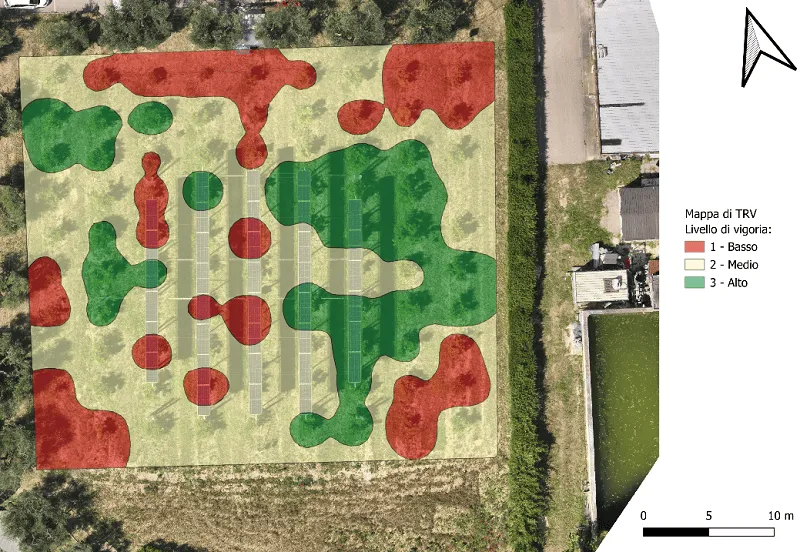
Fig.5: TRV (Tree Row Volume) index map of a citrus grove under agrivoltaics.
- CWSI (Crop Water Stress Index): this measures the water stress status of crops, derived mainly from leaf temperature relative to air temperature. Here too, Figure 6 identifies water stress plant by plant. The individual value was then spatialised to obtain a field map (Figure 7). The goal is to assess irrigation requirements and manage water more efficiently.
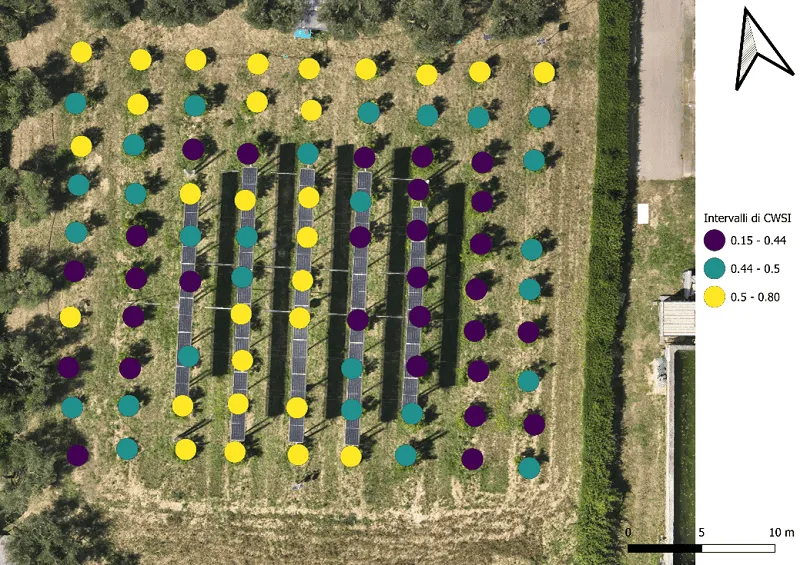
Fig.6: Point-by-point CWSI (Crop Water Stress Index) analysis for individual citrus plants.
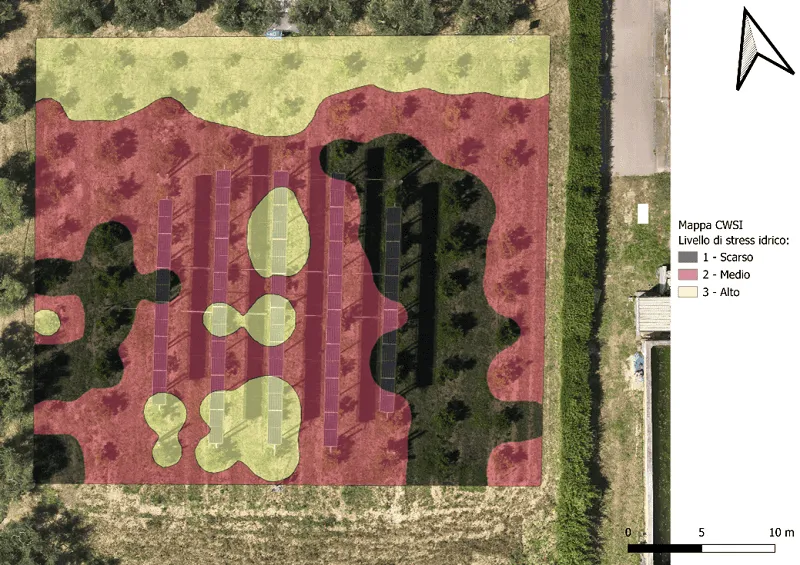
Fig.7: CWSI (Crop Water Stress Index) index map of a citrus grove under agrivoltaics.
Conclusions
The survey carried out made it possible to obtain a detailed analysis of the citrus grove within the agrivoltaic system, examining in depth the canopy characteristics of the plants, including those beneath the photovoltaic panels. This was made possible by using drones to acquire low-altitude data capable of generating 3D models of the plot, which make it possible to overcome the difficulties of 2D or satellite analysis, which would not allow crops beneath the panels to be analysed. The maps produced are essential for farmers to make informed decisions and intervene in a targeted way. In this case study, which featured different citrus varieties at different growth stages, it was possible to highlight that, in the northernmost area of the field, there was high water stress as well as low canopy vigour. In the area where the photovoltaic panels are installed, the situation was predominantly one of medium vigour and a medium level of water stress. More specifically, there were a few spots of plants with clearly poor vigour and high stress. In contrast, the area furthest to the right of the field was found to be in the best condition. The Agrobit team knows that agrivoltaic systems represent a great opportunity for farmers. That’s why, thanks to the iDrone service, we can support your agronomic decisions and improve resource use in the field. Thanks to CIHEAM Bari for making it possible to carry out this survey at their experimental agrivoltaic facility.