
Vegetation parameters
Measure the height, thickness and volume of the canopy, plus LAI, LWA and TRV, from a photographic scan of the plant with your smartphone.
The app that turns your smartphone into a professional agronomic tool: crop analysis, weather, disease identification and prescription maps, without costly extra hardware.


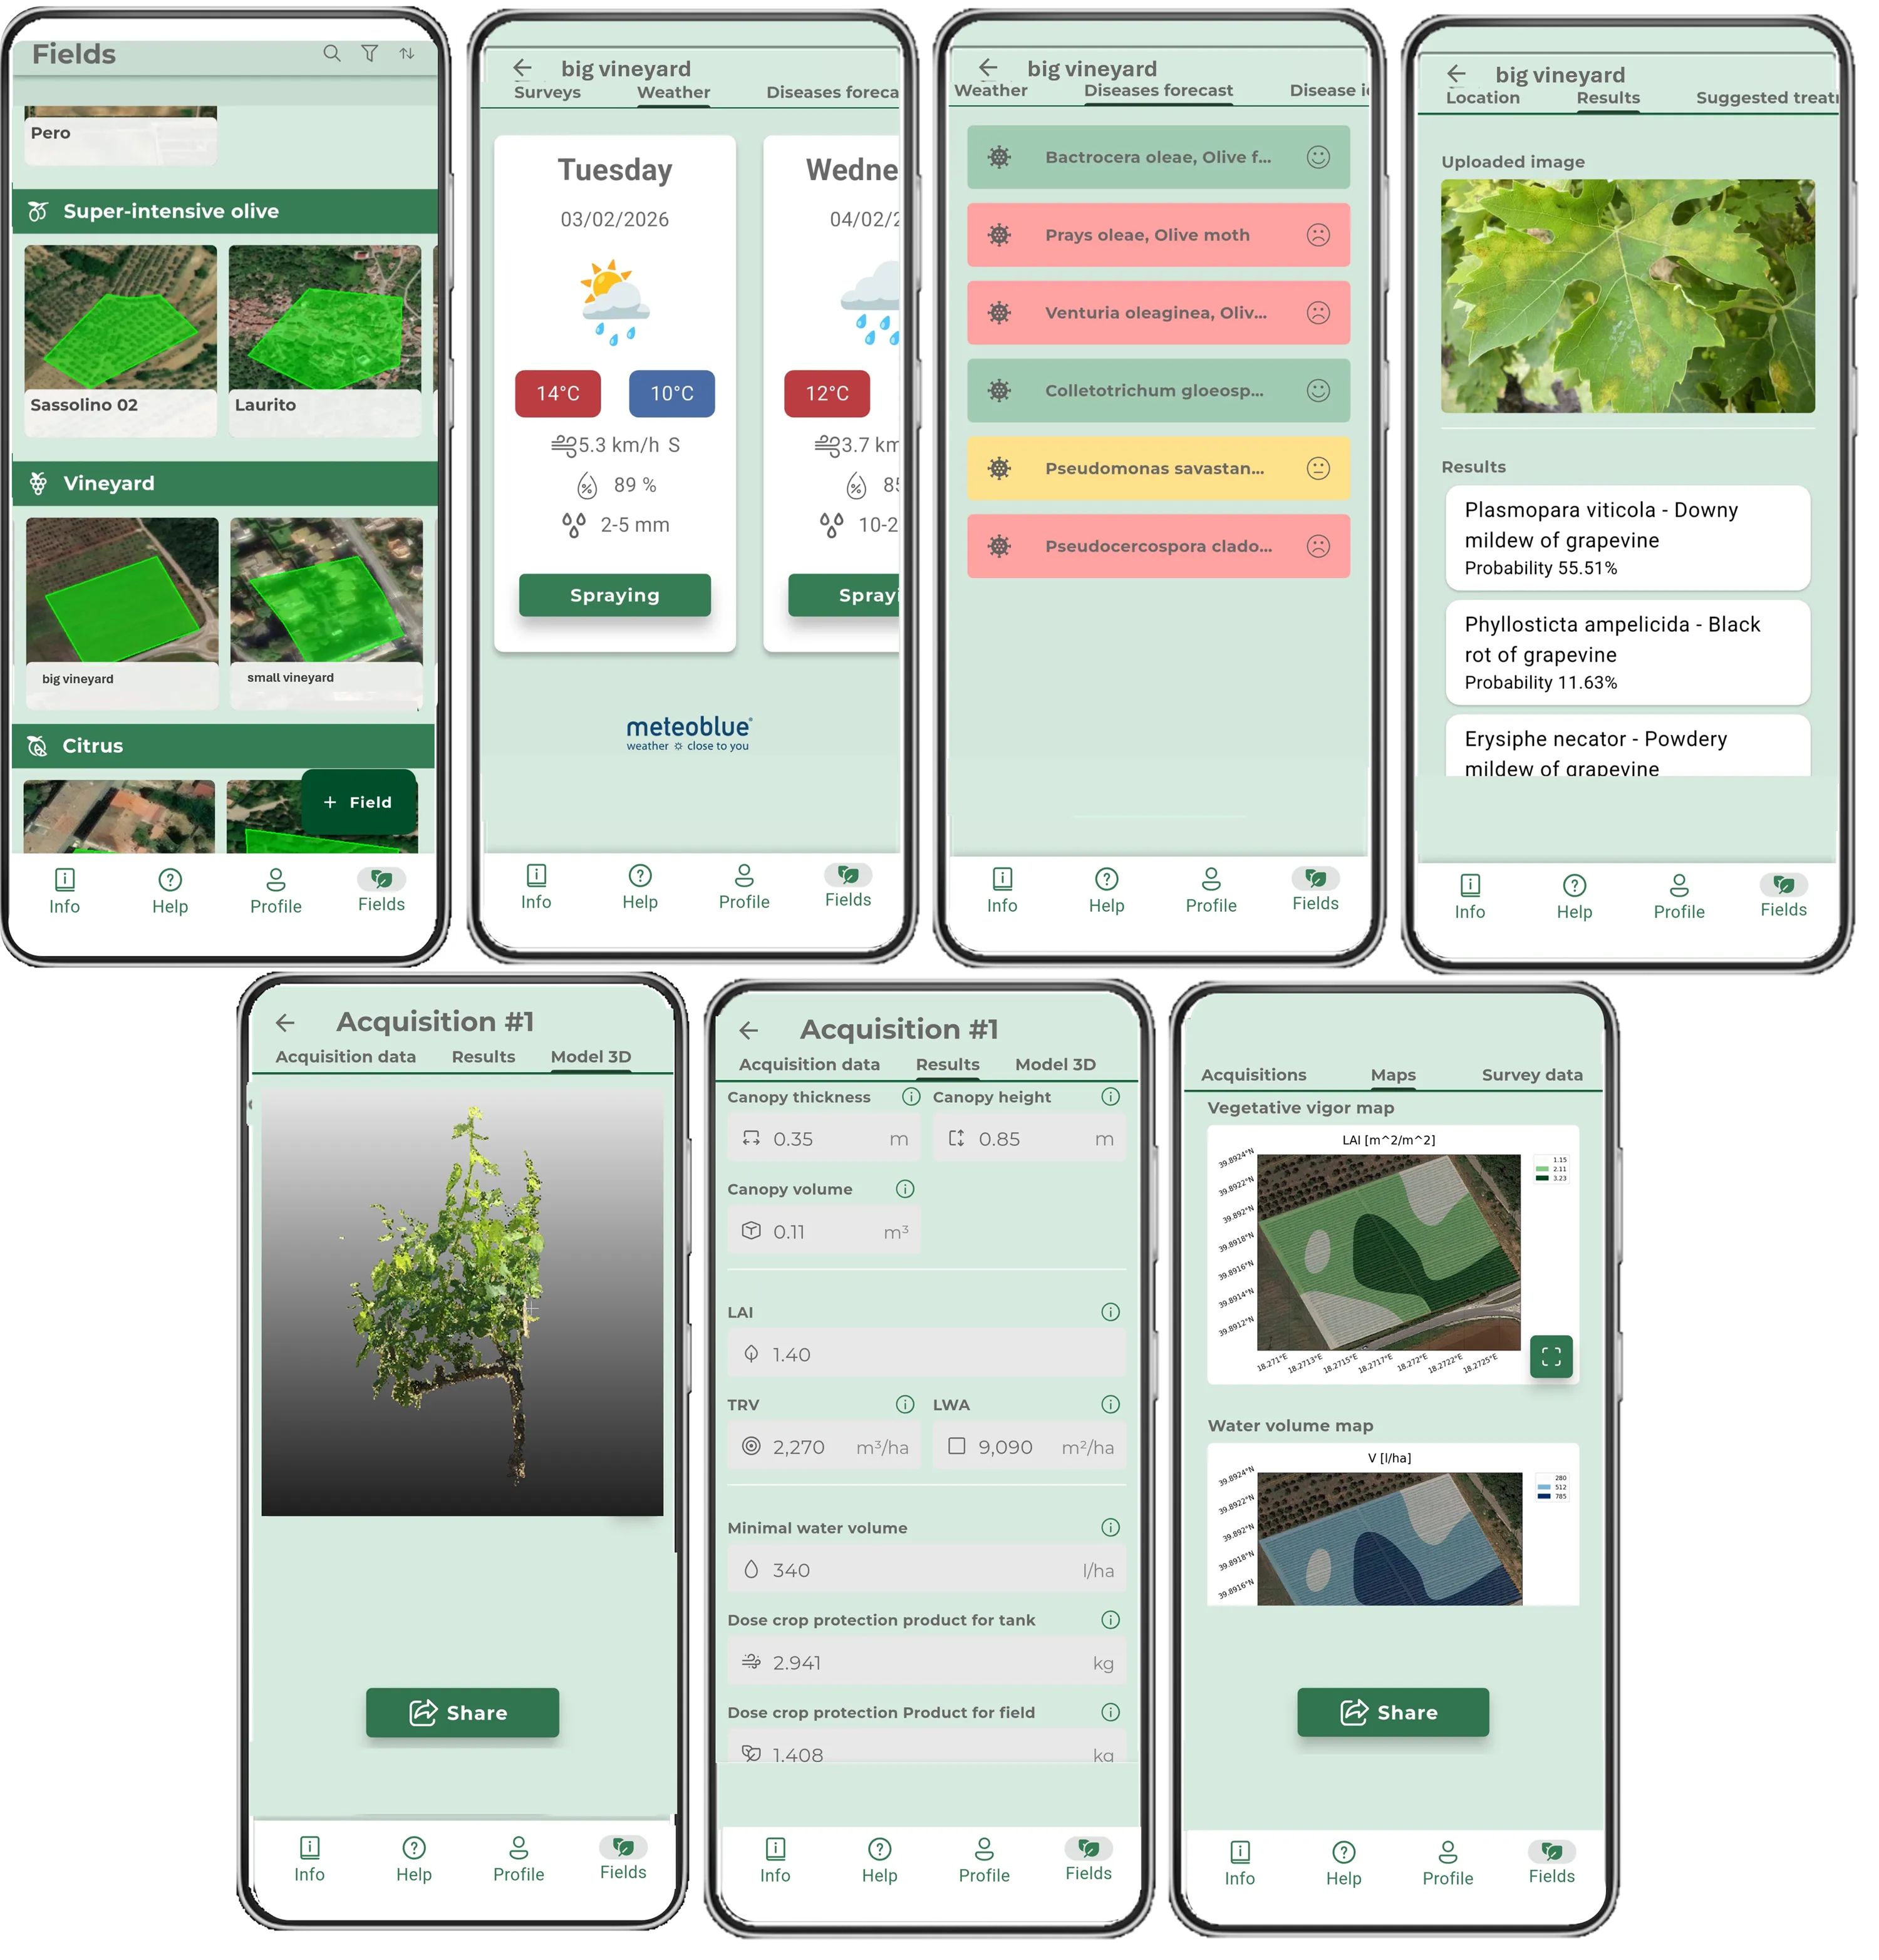
A single tool to collect data in the field and turn it into agronomic decisions.
Point the camera at the plants: the app estimates the biometric parameters (thickness, height, biomass volume).
Estimation of LAI, LWA and TRV to calibrate treatment volumes and dosages objectively.
More than 250 predictive models of diseases and insects, with risk indices up to 7 days in advance.
Identification of plant diseases from a photo of leaves, flowers, fruit or trunk, with the recommended treatments.
Ultra-local weather monitoring and forecasts to plan cultivation operations.
NDVI, NDRE, TCARI/OSAVI and NDMI satellite indices for vigour, chlorophyll and water stress, with history up to 2 years.
Texture and physico-chemical parameters of the soil up to 1 metre deep.
Calculate the CO₂ absorption of canopy and soil and monitor how it changes over time.
Estimation of the number and size of fruit to support yield forecasting and mapping.
Generate a digital twin of vineyards and orchards from the acquired images.
Sample at least 5 points in the field to generate vegetative-vigour maps and manage inputs and harvest in a site-specific way.
Generate maps for variable-rate treatments and optimise the dosing of plant protection products.
Reports generated automatically by the AI with a summary of the surveys and the agronomic recommendations for each scan.
Collection of georeferenced field data and export of data and agronomic maps.
Dedicated APIs to integrate iAgro data into business management systems and third-party information systems.
The results of those who use iAgro to guide their decisions in the field:
Users worldwide
Hectares digitised
Use of chemical inputs and water
Increase in yield
Reduced impact on the environment and rural communities
Crop analysis, weather, predictive models, disease identification, vigour and prescription maps: all in a single app, with no extra hardware.
Measure the height, thickness and volume of the canopy, plus LAI, LWA and TRV, from a photographic scan of the plant with your smartphone.
Hyperlocal weather forecasts (1-5 km) up to 7 days, with hourly spraying windows to plan treatments.
More than 250 predictive models of diseases and insects, with risk indices up to 7 days in advance.
Take a photo of leaves, flowers, fruit or trunk: the AI identifies the 3 most likely diseases and the recommended treatments.
NDVI, NDRE, TCARI/OSAVI and NDMI satellite indices for vigour, chlorophyll and water stress, with history up to 2 years.
Texture and physico-chemical parameters of the soil up to 1 metre deep.
Calculate in a few seconds the CO₂ absorption of canopy and soil and monitor how it changes over time.
Automatically count the fruit from a photo and generate spatialised yield maps to identify the more or less productive areas.
The leaf area index (LAI) measured from the scan, to objectively assess the vigour of the crop.
Sample at least 5 well-distributed points in the field to generate vegetative-vigour maps and manage inputs and harvest in a site-specific way.
Zone-based prescription maps with the optimal dose of water and plant protection product: save up to 50% of water.
Film the plants with your smartphone camera, following the app's guide.
iAgro estimates height, thickness and biomass volume and builds the digital twin of the crop.
Get advice on protection, nutrition and irrigation and maps ready for the field.
Data sheet, user guide and video tutorial to get started with iAgro.
Features, subscription plans and benefits in one sheet.
Download →The complete guide to using the app, step by step.
Download →The quick guide to learning to use iAgro in the field.
Download →The list of mobile devices compatible with the iAgro app.
Download →The video tutorial on YouTube to learn to use iAgro step by step.
Watch →iAgro is a decision-support app (DSS) for precision agriculture and digital farming that harnesses technologies such as augmented reality (AR), artificial intelligence (AI), computer vision, digital twin and cloud computing. iAgro provides georeferenced and time-stamped information on the key biometric and biophysical parameters of woody crops, helping farmers and technicians make better decisions in the management of agronomic inputs. The app lets you consult ultra-high-resolution weather forecasts up to 7 days with the ideal windows for spraying treatments, predictive models of the main diseases with a risk index at 7 days and identify diseases through photos. Also under development is the feature to suggest treatments based on the detected disease, yield forecasting (fruit counting and sizing), the quantification of absorbed CO2 and reports generated with generative AI to give information on climate, soil and crop. The app also lets you create vigour maps and prescription maps for optimised plant protection treatments, estimating the optimal doses of water and plant protection products to distribute in the plot.
iAgro is available for most mobile devices. A complete list can be found here.
iAgro is available for most woody crops, whether intensive, super-intensive or without a planting layout: vine, olive, stone fruit (plum, peach, apricot, cherry, almond, pistachio, hazelnut), pome fruit (apple, pear), citrus (orange, lemon). tropical crops (mango, guava, banana, papaya, coffee, cocoa, avocado).
Being a cloud-based app in which all data is stored online, iAgro requires an internet connection. However, you can create fields and surveys before going into the field and, once the photos have been collected in an acquisition, you can also upload them at a later time. In addition, you can carry out 3D scans even without sufficient network coverage or offline.
The iAgro app is a precision-agriculture tool to improve business processes, in particular to optimise and reduce the input of chemicals and water. Being a DSS, it is normally eligible for funding under the regional and national calls that facilitate access to precision-agriculture tools. For more precise information based on the specific call, contact us!
iAgro is available in a free version up to 1 hectare with limited features. Paid versions are available depending on the number of hectares and the number of acquisitions, the details of which are available here.
Subscriptions can be purchased by credit/debit card through our shop by clicking here.
The limit on the number of production units that can be created within an organisation varies according to your subscription. For more info see the subscription features here.
You can create, edit or delete production units within the "Profile" section.
The weather data provided by the app with a 7-day forecast generally has an accuracy of 1-2 km (in the first 3 days of the forecast) and of 10-12 km (in the following days up to the seventh). We rely on reliable external providers for the supply of this data.
The predictive models for diseases and insects are based on data from established scientific literature and have an accuracy that goes hand in hand with the weather forecast data. We rely on the best providers to get this data as close as possible to the local microclimate of the plot.
The accuracy of disease identification depends on many factors such as the quality of the image, its exposure and the adequate closeness to the detail you want to investigate. For optimal analyses, the photo should not be under-/over-exposed to sunlight nor in shadow and should not be photographed too far away or too close. In addition, for some diseases in which the symptoms are similar to each other or not very evident, the identification could be wrong.
There is no limit to the number of fields that can be created within a production unit. The only limit is that of hectares, which varies according to your subscription. For more info see the subscription features here.
There is no limit to the size of individual fields. The only limit is that of hectares, which varies according to your subscription.
There is no limit to the number of surveys that can be created within a field. For more info see the subscription features here.
The 5-day limit has been introduced to avoid mixing, within the same survey, information coming from different phenological phases. This avoids having maps and information coming from time points very distant from each other.
There is no limit to the number of acquisitions that can be created within a survey. The only limit is that of the maximum number of global acquisitions, which varies according to your subscription. For more info see the subscription features here.
The minimum number of photos per acquisition is 50, while the maximum number is 250. This range is sufficient for any situation and ensures that the 3D model is reproduced correctly and therefore also the related results.
Yes, it is possible. It is not necessary to upload the photos to the cloud immediately, especially if in the field you have poor signal and poor internet network.
If you have little internet connection in the field, it is possible that you may not be able to carry out and/or correctly save the acquisitions. The suggestion is to move to another point of the field where you have sufficient internet connection.
If you have little GPS signal in the field, it is possible that you may not be able to carry out and/or correctly save the acquisitions. The suggestion is to move to another point of the field where you have GPS signal.
If the 3D model of the scanned plant shows holes or poor reconstruction of the geometry, it is likely that the photos were taken too close or that some or all of the photos do not contain some parts of the plant. The advice is to repeat the acquisition while keeping an adequate distance from the plant, as indicated in the tutorial and in the video tutorial.
The phone should always be held vertically, as indicated in the tutorial and in the video tutorial.
Acquisitions should be made only on plants with leaves that have a colour in the shades of green, therefore not on plants that do not have leaves, i.e. with bare branches only, nor on plants with brown/red/yellow leaves.
Yes, you can invite collaborators to your organisation through the "Invitations" function available in the "Profile" section within the app. The invited person will receive the invitation by email and will be able to log in with the same email (after registering with the app if they have not yet done so). The invited person will see everything that is present within the organisation, i.e. they will see the production units, the fields, the surveys and the acquisitions with the related results. They will also be able to export all the data and the maps. The only thing they will not be able to see are the photos of the acquisitions not made by them, because these are present only on the phone of the person who carries out the acquisition.
The person invited to collaborate in an organisation will have available the subscription of the account that invited them. Therefore, even if the invited person basically has a free subscription, the moment they are invited to the organisation they will have available the subscription of the latter, without having to pay additionally for it.
Download the app and start with the Free plan: 1 hectare and 10 scans included. Move up to a higher plan whenever you like.