
Case Study: maps and models to support olive growers
Introduction
Olive growing is an ancient practice involving the cultivation of the olive tree (Olea europaea) for the production of table olives and, above all, olive oil. This agricultural sector is of great economic and cultural importance in many regions of the world, particularly in Mediterranean basin countries, becoming an essential part of the culture and economy of many communities. In recent years, the olive supply chain has been undergoing major transformations, including competition from new producer countries internationally, the emergence of plant health emergencies, and changes in climate conditions. To effectively tackle these challenges, Agrobit provides a range of innovative services and tools that support businesses in managing their olive groves and optimising the quality of the final product.
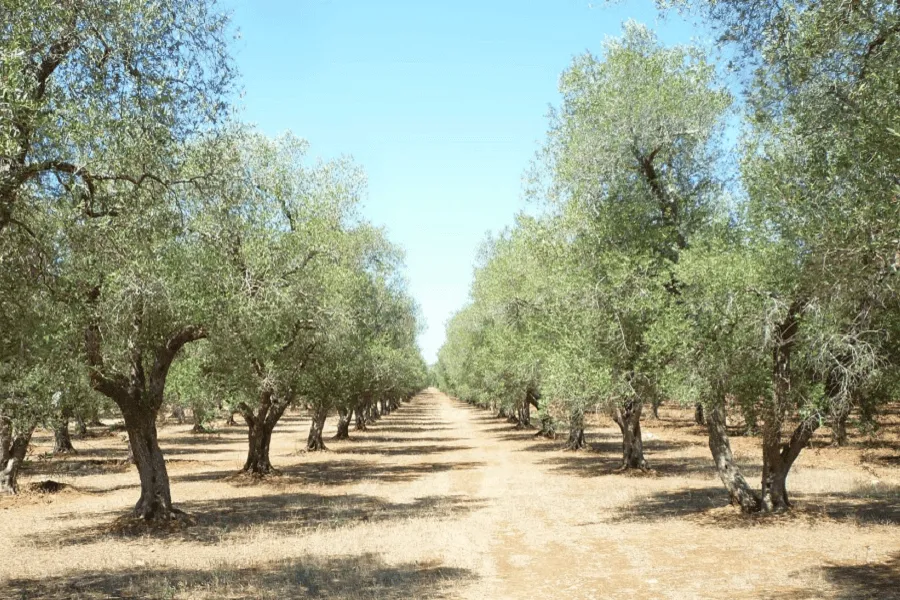
Fig.1: Olive grove
iDrone: variability maps generated by drone
By analysing visible (RGB), multispectral and/or thermal images taken by drone, it is possible to reconstruct thematic olive grove maps, such as NDVI (Normalized Difference Vegetation Index) maps, an important tool used to monitor and assess olive grove vigour (Fig. 2).
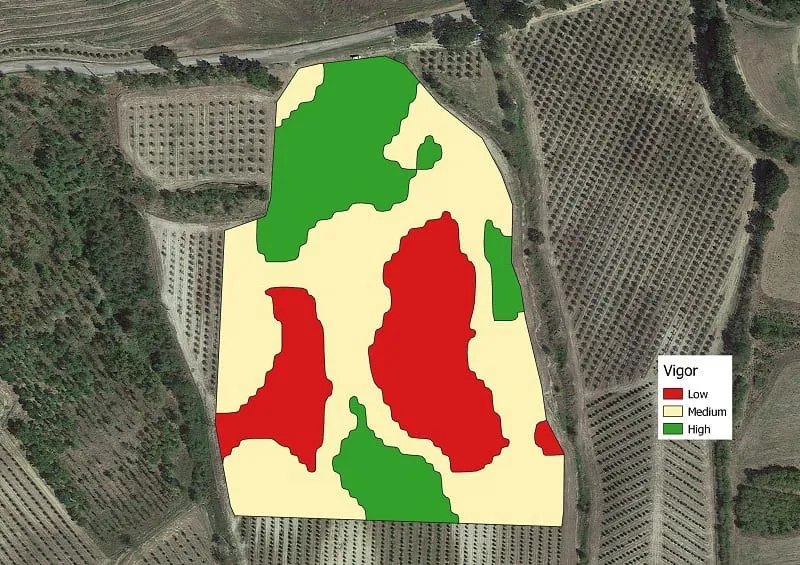
Fig.2: Vigour map of an olive grove in three classes: low, medium, high
The maps can be used for various purposes:
1. Streamlined crop protection treatments
Vigour maps make it possible to identify and characterise field variability, allowing zoning maps to be created that, once loaded onto variable rate (VRT) machinery, make it possible to concentrate treatments in more vigorous areas and apply less product in less vigorous areas, optimising the use of water and pesticides.
2. Differentiated fertilisation
Through vigour maps, which make it possible to identify field variability, it is possible to customise fertilisation according to the specific needs of your olive grove. This allows for more precise nutrient management, reducing waste, and improves distribution proportionally to the areas where it is most needed. When carried out correctly, differentiated fertilisation based on vigour maps helps to optimise fertiliser use. Indeed, by distributing smaller amounts of fertiliser in already-vigorous areas and larger amounts in less vigorous areas, nutrient distribution in the field is improved and variability is reduced.
3. Optimising irrigation and managing water stress
Using thermal cameras mounted on drones, temperature maps can be generated to consciously manage water stress. These maps provide information on the temperature of olive trees and soil, helping to identify areas subject to water stress. These critical areas can be identified in a timely manner in order to take preventive action and define targeted irrigation scheduling, allowing olive growers to make more informed irrigation decisions for more conscious use of water resources. The CWSI (Crop Water Stress Index) is an indicator used in agriculture to assess the level of water stress in crops (Fig. 3). The maps can indicate the areas of the olive grove that need irrigation or that have drainage problems or waterlogging, allowing for targeted management of water resources to improve plant wellbeing, reducing the risk of incorrect irrigation management.
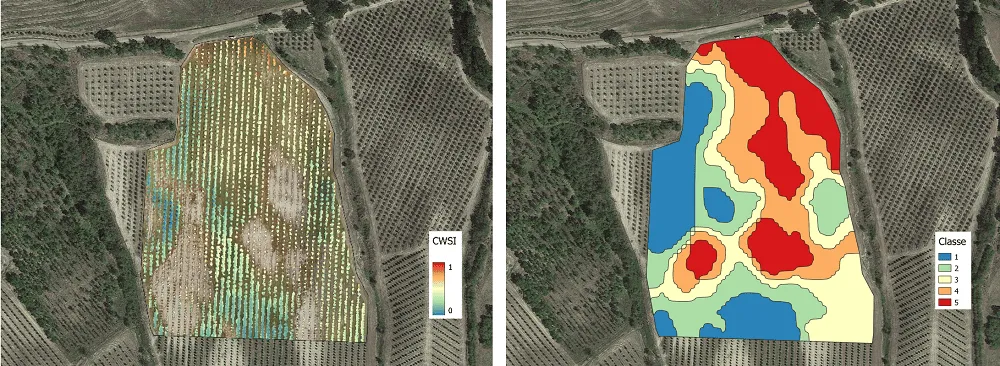
Fig.3: Water stress map of an olive grove (CWSI). On the left, water stress in the canopies (in red, higher water stress; in blue, good water status). On the right, water stress zoning obtained by reclassifying and spatialising CWSI values. Values range from 1 to 5, i.e. from lower to higher stress levels.
iAgro: precision olive growing from a smartphone
Among Agrobit’s solutions is also iAgro, the first site-specific mobile DSS app capable of optimising crop protection treatments and creating olive grove vigour maps simply using your smartphone.
With iAgro, through a guided photographic scan of an olive tree (Fig. 4), it is possible to quickly and objectively measure several parameters, in particular:
- the height, thickness and canopy volume of the scanned plant;
- the Leaf Area Index (LAI);
- the Leaf Wall Area (LWA);
- the Tree Row Volume (TRV);
- the optimal water dose for crop protection treatments at each phenological stage.
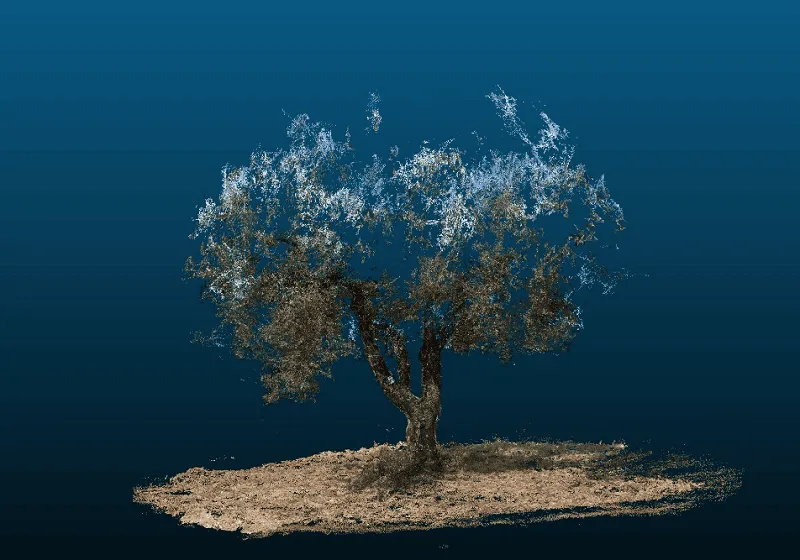
Fig.4: 3D point cloud of an olive tree generated by the iAgro app
By sampling a sufficient number of well-distributed plants in the field (at least 5 points per field), the app automatically generates vegetative vigour maps (LAI index), which can be used to optimise fertilisation, and prescription maps for variable, optimised crop protection treatments, based on the olive grove’s actual needs at each phenological stage recorded (Fig. 5).
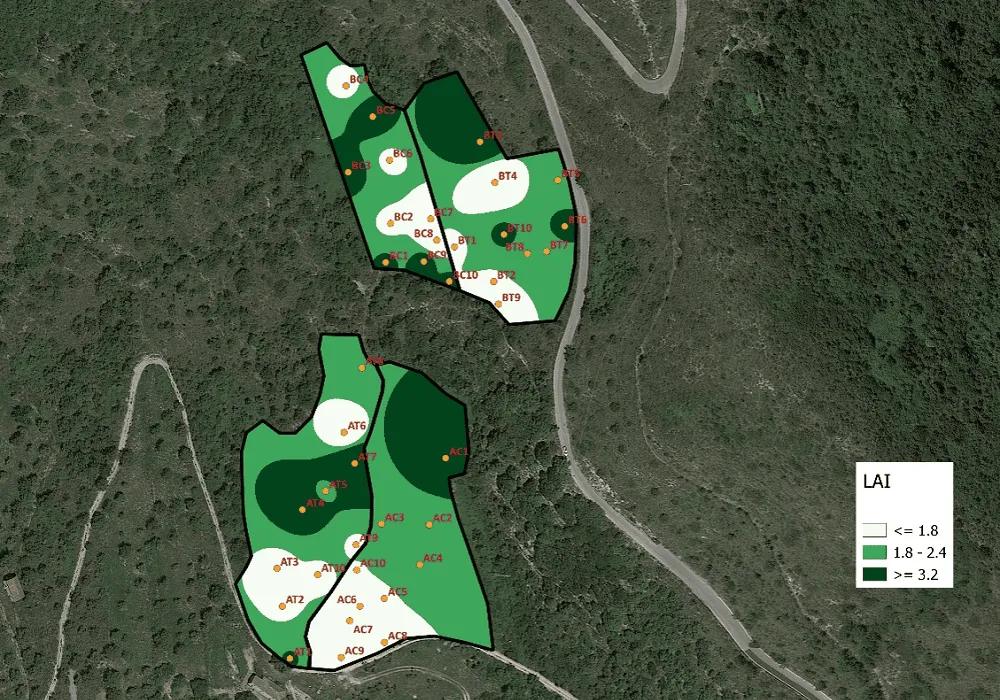
Fig.5: Vigour map (LAI index) in 3 classes generated by the iAgro app (in yellow, the points scanned with the app), which can be used to optimise fertilisation. Whiter zones correspond to lower vigour compared with greener zones, which have higher vegetative vigour.
Depending on the type of treatment and the farm’s sprayer, the app will be able to create a prescription map for the correct dose of water and pesticide to be applied (Fig. 6), always in accordance with the manufacturer’s label. Thanks to iAgro, it is possible to save up to 60% of water per treatment and distribute pesticides more effectively, with positive economic, environmental and social implications.
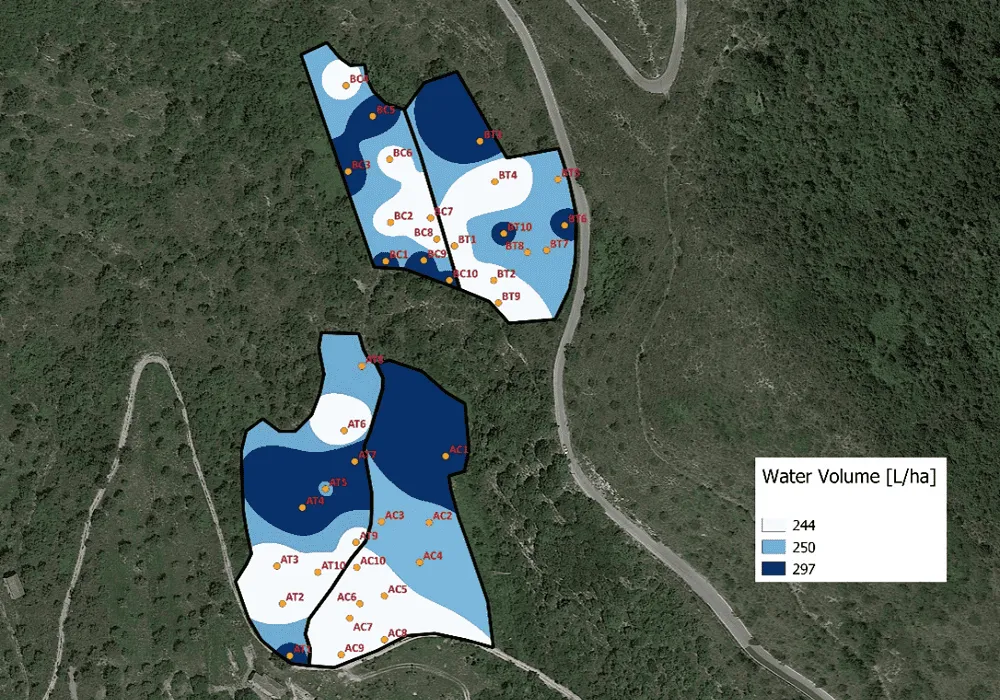
Fig.6: Water dose prescription map (l/ha) in 3 classes generated by the iAgro app (in yellow, the points scanned with the app), which can be used to optimise crop protection treatments, including by loading it directly onto variable rate (VRT) machinery
Weather stations, DSS and forecasting models
In the context of quality olive growing, weather stations and forecasting models are irreplaceable tools that form genuine agronomic decision support systems (DSS, Decision Support System). Their importance is crucial, as they provide essential data for optimal olive grove management and for making informed decisions based on information from the field (soil and microclimate).
Weather stations collect real-time weather data, such as temperature, humidity, rainfall, leaf wetness, wind speed and direction, etc., while forecasting models use this data, together with accurate weather forecasts and mechanistic models based on olive tree biology, to provide useful decision support information such as:
- crop phenology (development stage or ripening stage);
- the risk of pathogen infestation at each point in the growing cycle;
- nutritional and water requirements.
An example of a DSS for olive growing is Oliwes, an Agricolus solution that provides a range of very useful information for farmers, including:
- Phenological model: phenology forecasting to assess the olive grove’s needs at each stage of development;
- Irrigation requirement estimate: to intervene when necessary with the optimal water supply;
- Fertilisation model: calculation of total nitrogen, phosphorus and potassium requirements to provide suggestions on fertiliser doses to apply;
- Forecasting models for diseases and harmful insects (olive fruit fly): it is now well known that, among the threats to olive growing, the olive fruit fly represents a significant threat to olive yield and quality. Female flies lay their eggs inside the drupes, damaging the pulp as the larvae feed and causing affected fruit to fall prematurely. In Oliwes, it is possible to forecast these infestations in order to intervene promptly, thanks to the fly mortality model, which describes the daily and weekly mortality rate of young fly forms based on the minimum and maximum temperatures recorded by the weather station, and the fly development model, which estimates the distribution of the fly population across the various phenological stages, i.e. the progress of individual stages over time and the number of annual generations of the insect, using hourly temperature data (Fig. 7). These forecasts allow olive growers to adopt preventive measures and treat more efficiently and effectively.
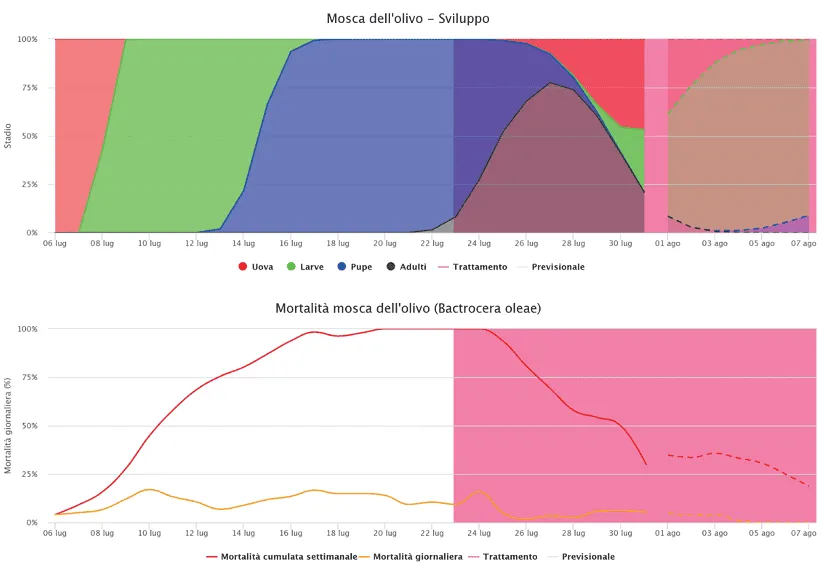
Fig.7: Forecasting model for the development (top) and mortality (bottom) of the olive fruit fly
Conclusions
Managing the olive grove with pesticides and fertilisers has a significant impact on a business’s economic and environmental balance. It is important to implement the streamlining of farming practices that characterise olive grove management, using tools that reduce environmental impact, making the business more sustainable and competitive on the market and in line with new regulations (European Green Deal and Farm-to-Fork Strategy).
Using olive grove vigour maps, generated with the iDrone service or independently with the iAgro app, allows farmers to adopt a more targeted, sustainable approach to olive tree management, improving the quality of the finished product and reducing resource waste. This operational strategy stands out for its notable robustness in outlining the olive grove’s specific characteristics, focusing in particular on defining the variability naturally present in the field, allowing the business to build an increasingly precise identity and stand out on the market.
Using weather stations and forecasting models allows olive growers to make decisions based on scientific data and reduce risks, improving olive quality and yield and, as a result, oil production. In the olive-growing sector, where temperature variations affect all the physiological processes governing phenological and physiological development, the ability to constantly forecast and monitor this type of information is essential for ensuring a high level of control over olive quality and adequate productivity. By using weather stations and forecasting models, olive growers can act at the optimal times, optimising crop protection operations and resource use, reducing waste and improving production efficiency.