
Case Study: using the iAgro app in the vineyard
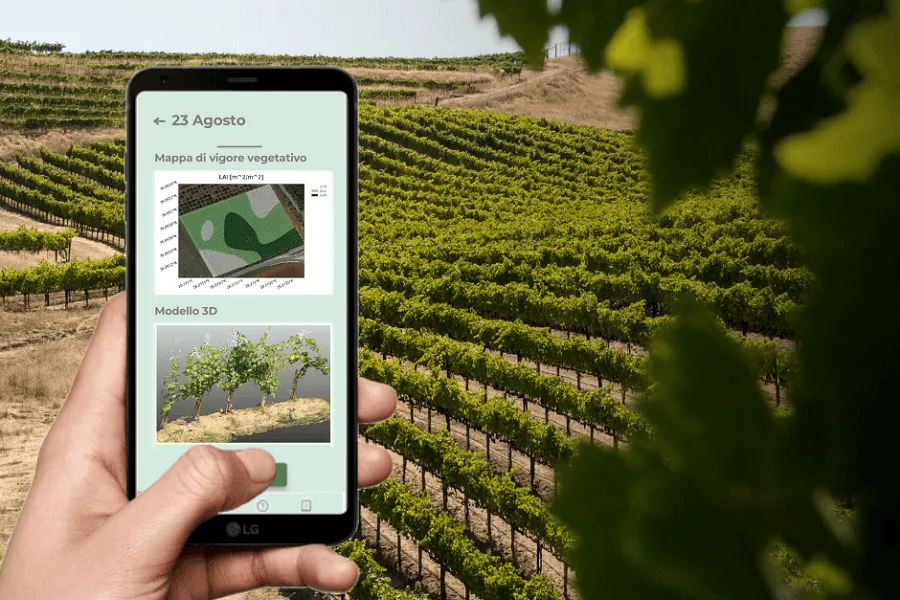
Vineyard monitoring and analysis with a smartphone app
Introduction
In the wine sector, precision and accuracy in vineyard management are crucial for achieving high-quality production. However, traditional methods of measuring plant vigour, such as using manual or visual methods to assess canopy thickness and height, can lead to subjective and inaccurate results. This approach not only compromises precision in vineyard management, but can also lead to excessive use of crop protection products, with negative consequences for the environment and production costs.
To address this challenge, iAgro was developed, an innovative application designed to objectively and scientifically characterise the vegetative development of each individual plant. iAgro offers agricultural technicians and winegrowers a reliable and efficient alternative to manual measurement, providing optimised data for calibrating sprayers for crop protection product distribution. As well as improving precision in the application of crop protection treatments, the data collected by iAgro also makes it possible to make informed decisions about overall vineyard management, including fertilisation and grape harvest scheduling.
Using the iAgro app in the vineyard
This case study focuses on a test vineyard at a major winery in Chianti Classico. During the 2023 vintage, a survey was carried out using the iAgro app to characterise the vigour of a vineyard of around 5 ha and to generate a two-class prescription map for differentiated crop protection treatments (Fig. 1). The trial was carried out on 30 May 2023, during the flowering phenological stage, sampling 15 plants.
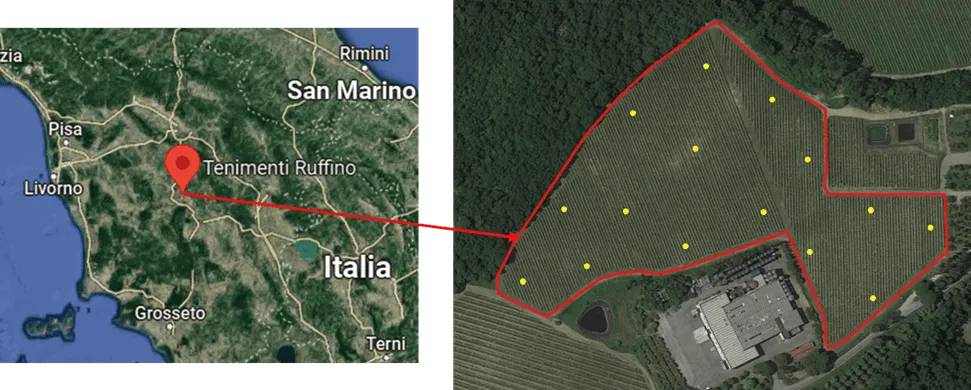
Fig.1: Location of the test vineyard.
With iAgro, through a quick photographic scan of all the sample plants, it was possible to generate the corresponding 3D model (digital twin) (Fig. 2) and quickly and objectively measure several parameters, in particular:
- the height, thickness and volume of the scanned plant;
- the Leaf Area Index (LAI);
- the Leaf Wall Area (LWA);
- the Tree Row Volume (TRV);
- the optimal water dose for crop protection treatments.
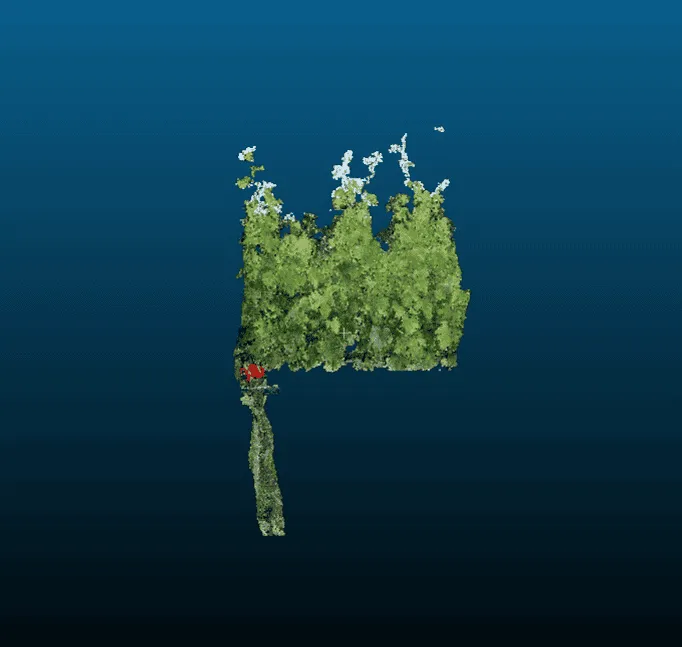
Fig.2: 3D reconstruction of a sample plant generated by the app.
By sampling a sufficient number of well-distributed plants in the field, the app automatically generated vegetative vigour maps (LAI index), which were then used to generate a prescription map for variable crop protection treatments optimised according to the vineyard’s actual needs (Fig. 4 and Fig. 5).
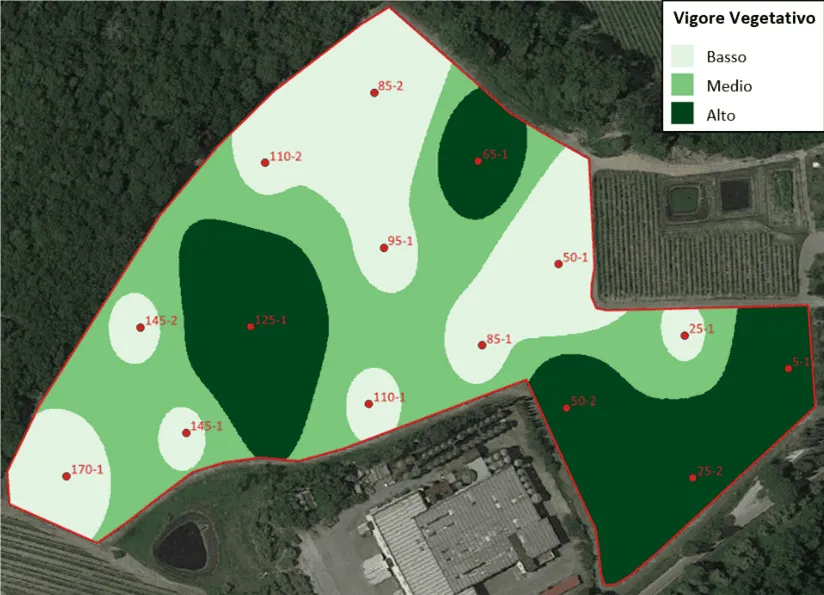
Fig.3: Vigour map (LAI) generated by the app, which can be used to optimise fertilisation and harvesting.
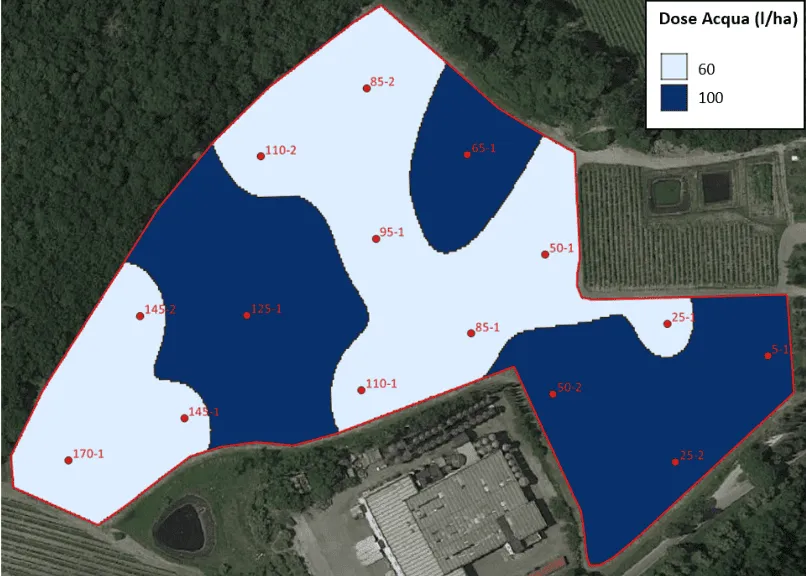
Fig.3: Prescription map generated by the app for optimised crop protection treatments.
Depending on the disease to be tackled (e.g. downy mildew) and the farm’s sprayer, the app can suggest the correct dose of water and pesticide to be applied, always in accordance with the manufacturer’s label. During the case study, thanks to iAgro it was possible to save 73% of water compared to the farm’s standard doses and distribute the pesticides more effectively. This not only represents a significant saving in water resources, but also demonstrates a tangible advantage in optimising pesticide use, improving product distribution in areas where it is most needed.
Conclusions
With iAgro, digital agriculture meets winemaking tradition, enabling more efficient, sustainable management based on objective data. The app aims to be a tool for promoting smart, environmentally friendly farming practices, with the goal of improving the quality and profitability of wine production.
With an innovative tool like iAgro, not only is vineyard management improved, but it also opens the door to further developments that directly involve the end consumer. For example, through a dedicated company page, it would be possible to transparently and engagingly show what happens in the field during each vintage, thereby improving the company’s image in the eyes of consumers.
The data collected in the field could be used for marketing purposes, providing consumers with detailed information about the production process, seasonal weather trends and more, adding value to the product and creating a deeper bond between the company and the consumer.
For more information on how the app works, you can visit the dedicated section on the website or watch the video tutorial.