
NDVI, NDRE, GNDVI vegetation indices: complete technical guide
NDVI, NDRE, GNDVI vegetation indices: complete technical guide
Introduction
Vegetation indices have by now become the common language of Italian precision agriculture: from vineyards in Chianti to olive groves in Puglia, agronomists and farms use NDVI, NDRE and GNDVI to read crop health without walking every single row. Various ISMEA analyses indicate that the adoption of remote sensing tools among Italian farms is growing steadily, driven by the 2023-2027 CAP and by the eco-schemes that reward input reduction. This technical guide explains what vegetation indices are, how they are calculated, where each one is genuinely worth using, and how to turn them into concrete agronomic decisions for vines, olive trees, orchards and arable crops.
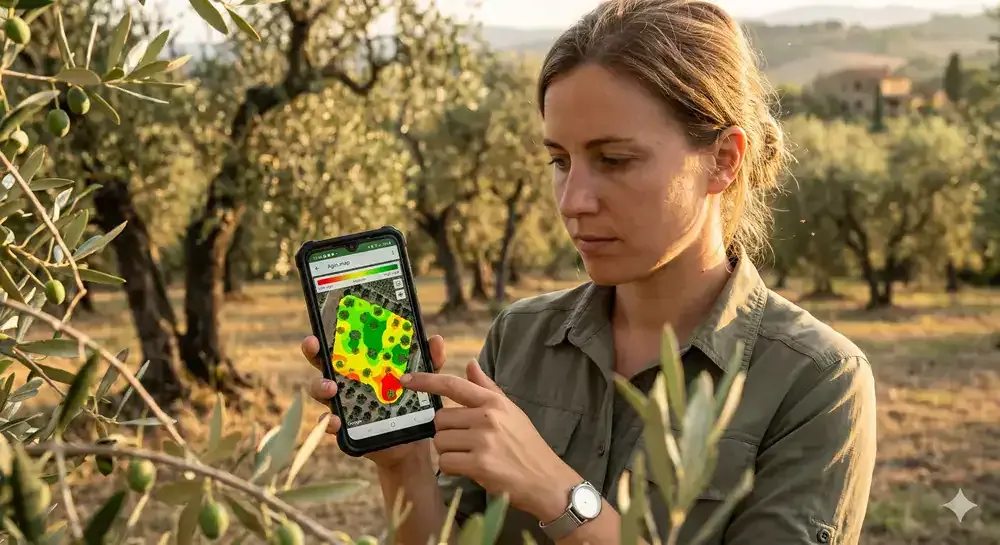
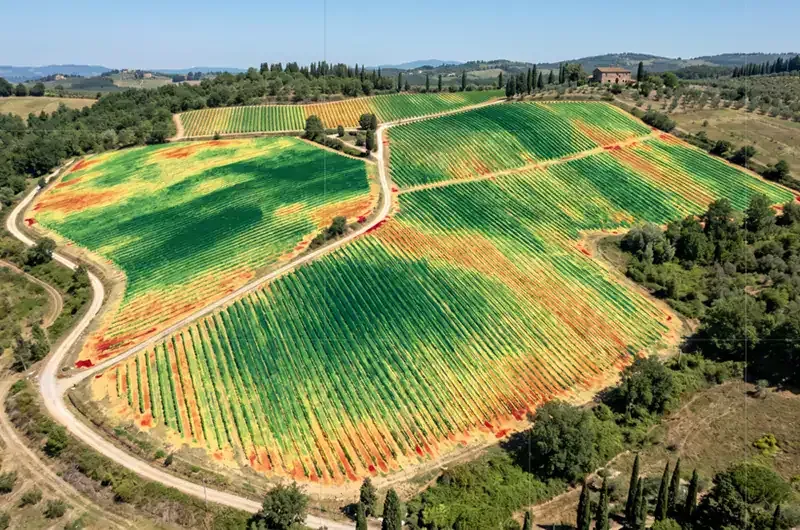
Fig.1: NDVI map: the colour gradient highlights zones of different vegetative vigour, the starting point for every vegetation index.
What vegetation indices are and what they are for
A vegetation index is a dimensionless number calculated as an algebraic combination of reflectance in two or more spectral bands; it is used to non-destructively estimate biophysical quantities such as vigour, chlorophyll content, biomass and water stress. It is the fastest way to turn a multispectral image into readable agronomic information, both at row scale and at estate scale.
The use of vegetation indices rests on three distinct application areas. The first is diagnosis: understanding where the crop is growing well and where it isn’t, identifying early disease outbreaks, mapping nutritional deficiencies. The second is prescription: turning the map into homogeneous zones for fertilisation, irrigation, treatments, harvesting or selective picking. The third is monitoring over time: comparing the same crop across successive seasons or throughout the current season, to assess the effect of agronomic practices and climate conditions.
Spectral reflectance: the underlying physical principle
Plants reflect, absorb and transmit light selectively. Chlorophyll strongly absorbs red light around 660 nm and blue light, while the mesophyll’s cellular structure reflects high amounts of radiation in the near infrared (NIR, 700-1300 nm). A vigorous plant therefore shows low reflectance in the red band and high reflectance in the NIR band; a stressed or senescent plant sees this ratio narrow and index values fall.
All “Normalized Difference” indices exploit this property: they relate a band where the plant absorbs to a band where it reflects strongly, normalising over the sum to obtain a stable range that is comparable across plots, seasons and sensors.
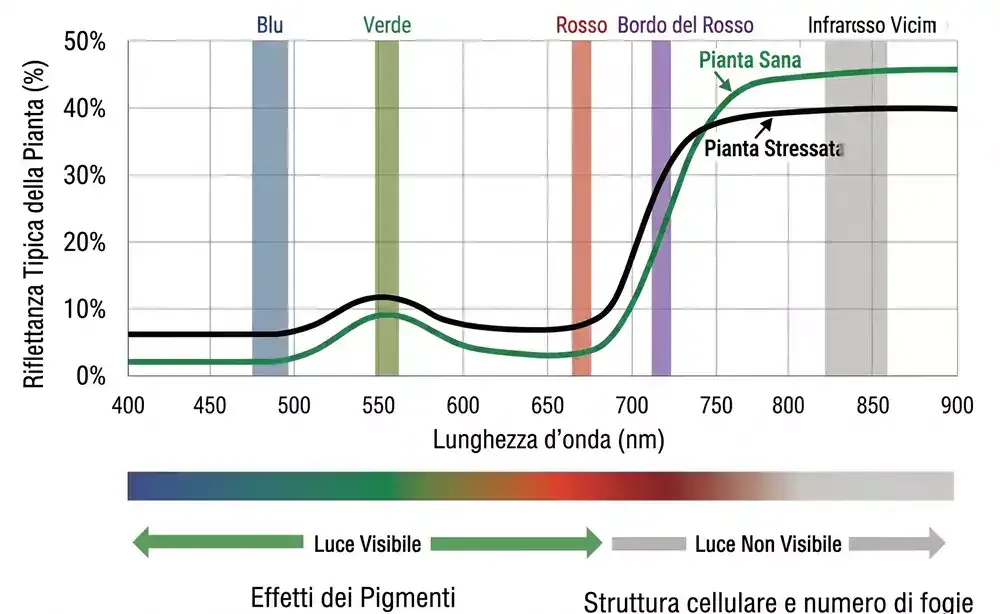
Fig.2: Spectral signature (or reflectance curve) of vegetation.
The red edge and near-infrared bands
The red edge is the transition region between absorption in the red band and high reflectance in the NIR band, typically between 690 and 740 nm. It is the part of the spectrum most sensitive to small variations in chlorophyll and leaf nitrogen, and it is what makes NDRE a more “responsive” index than NDVI in the later stages of the growing cycle, when leaf cover is already full.
Agricultural multispectral sensors, whether on a drone or on a satellite such as Sentinel-2 from the Copernicus programme, include at least one red edge band precisely to overcome the limitations of NDVI alone. To learn more about the technology, it is worth starting with drone sensors and the choice of available bands.
NDVI: the normalized difference vegetation index
NDVI (Normalized Difference Vegetation Index) is the normalized difference vegetation index. It returns a value between -1 and +1 and represents the historical benchmark of agricultural remote sensing, backed by four decades of scientific literature and available on any multispectral sensor, from the free Sentinel-2 satellite to precision cameras on drones.
The mathematical formula is: NDVI = (R_NIR − R_Red) / (R_NIR + R_Red), where R_NIR is near-infrared reflectance and R_Red is visible red reflectance. Typical interpretation thresholds are as follows:
- NDVI < 0: water, snow, clouds.
- 0 – 0.2: bare soil, rock, artificial surfaces.
- 0.2 – 0.4: sparse or stressed vegetation.
- 0.4 – 0.6: moderate vegetation, developing crops.
- 0.6 – 0.8: healthy, dense vegetation.
- 0.8 – 0.9: maximum vigour, full cover.
An NDVI of 0.7 indicates a healthy crop with good leaf cover and high photosynthetic activity, but the absolute interpretation always depends on species, phenological stage, geography and sensor. Credible comparisons are made between zones of the same field with the same crop at the same phenological stage, not between absolute values across different crops.
When to use NDVI and its limitations
NDVI works excellently during the vegetative development stage, on extensive crops without yet-complete cover (cereals, maize, soybean, sunflower) and for producing farm-scale vigour maps. However, it shows two well-documented operational limitations: saturation when the Leaf Area Index (LAI) exceeds around 3 (typical of vineyards, mature orchards, cereals at maturity), i.e. when leaf cover is fairly dense, and sensitivity to bare soil in sparse crops or in early stages, leading to underestimation of actual vigour.
NDRE: the response to the saturation limit
NDRE (Normalized Difference Red Edge) is a vegetation index that replaces the red band with the red edge band in the classic formula: NDRE = (R_NIR − R_RedEdge) / (R_NIR + R_RedEdge). It retains sensitivity where NDVI saturates, making it the index of choice for dense canopies, vineyards in full vegetation, mature orchards and cereals at heading stage.
Practical differences between NDVI and NDRE
The key distinction is reading depth: red light is absorbed within the first layers of leaves, while red edge light penetrates deeper into the canopy, reaching intermediate and lower leaves. This is why NDRE responds better to variations in chlorophyll and nitrogen in well-developed canopies. In viticulture, for example, after veraison NDVI returns almost uniform maps, while NDRE continues to discriminate between zones of different vegetative-productive balance.
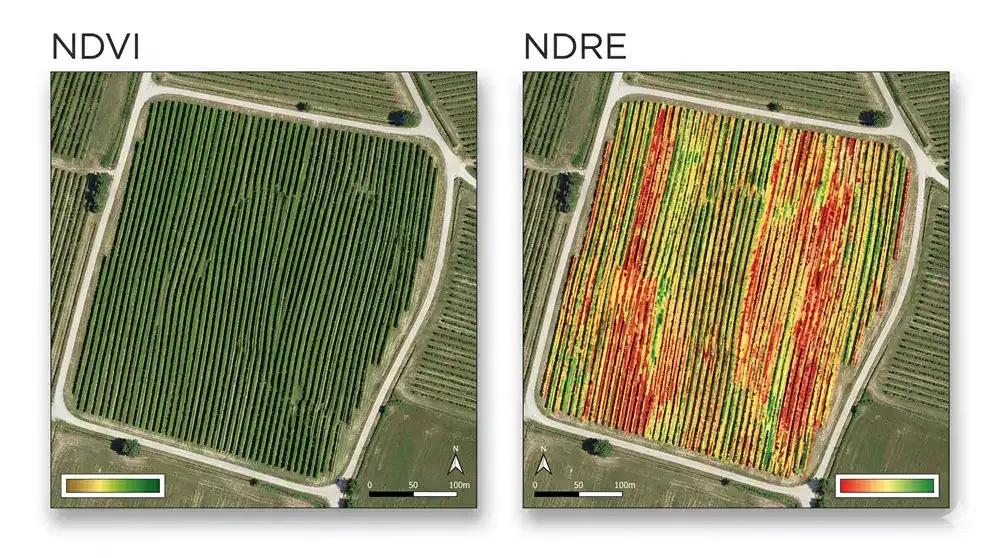
Fig.3: NDVI/NDRE comparison on the same plot: the NDRE map retains internal variability even where NDVI saturates.
Applications in viticulture and olive growing
In high-value-added supply chains, NDRE supports three operational decisions: selective harvesting (mapping vigour at veraison and dividing the harvest into homogeneous batches), nitrogen management (calibrating fertiliser interventions on genuinely different zones) and identifying localised stress (deficiencies, pest attacks, root problems). Documented experience in Agrobit’s case studies and work on maps and models to support winegrowers shows how combining NDVI and NDRE improves the quality of operational choices compared with visual assessment alone.
GNDVI, MCARI and TCARI/OSAVI: the chlorophyll indices
Beyond the NDVI/NDRE pair, more specific indices exist, built to isolate precise spectral contributions and reduce noise from soil or leaf cover. The main ones are GNDVI, MCARI and the TCARI/OSAVI ratio: they meet fine-grained diagnostic needs and are often used in combination to interpret the crop’s physiological status.
GNDVI: sensitivity to green
GNDVI (Green NDVI) replaces the red band with the green band: GNDVI = (R_NIR − R_Green) / (R_NIR + R_Green). It correlates more closely with leaf chlorophyll concentration than classic NDVI, making it suitable for reading nutritional status, particularly nitrogen deficiencies in later stages. Studies show a good correlation between GNDVI and leaf nitrogen content in straw cereals and maize.
MCARI and TCARI/OSAVI: chlorophyll without soil interference
MCARI (Modified Chlorophyll Absorption Ratio Index) and the TCARI/OSAVI ratio are chlorophyll indices designed to minimise the effect of bare soil and canopy structure. They are useful in olive groves, widely spaced orchards and in the early development stages of annual crops, when leaf cover is partial and “classic” indices are heavily affected by the background.
CWSI and water stress indices
When the question is “how much water is the crop lacking”, classic vegetation indices are not enough: a thermal band is needed. CWSI (Crop Water Stress Index) compares canopy temperature with air temperature and with reference temperatures for well-irrigated and maximum-stress conditions, returning a value between 0 (no stress) and 1 (maximum stress). It is the cornerstone index of precision irrigation, particularly useful in olive groves and vineyards where controlled water deficit is a quality lever.
How to acquire the indices: smartphone, drone, satellite
Vegetation indices can be derived from various digital platforms, each with a different trade-off between cost, resolution and frequency. The choice depends on farm size, the crop’s unit value and the agronomic question being asked.
- Satellite (Sentinel-2, Landsat): free, global coverage, 10-30 m resolution, 5-day revisit (cloud cover permitting). Ideal for seasonal, estate-scale monitoring and for cereals, but limited by cloud cover and by resolution on rows in tree crops (high presence of soil and inter-row).
- Multispectral/thermal drone: 1-10 cm resolution, on-demand, extremely high-quality data but a professional service. This is the reference platform for vineyards, orchards, olive groves and for early phenological stages in cereal/vegetable crops.
- Smartphone: high resolution at plant level, point-based reading via RGB camera with algorithms, low cost, daily frequency. Ideal for agronomic scouting and for small-to-medium farms.
Within the Agrobit ecosystem, all three platforms coexist: iDrone drone surveys for high-precision maps, the iAgro app for smartphone-based monitoring that also integrates Sentinel-2 satellite data.
Turning indices into concrete agronomic actions
An index map only has value if it becomes a decision. The standard operational workflow involves four steps: acquiring the multispectral data, calculating the chosen index, zoning into homogeneous classes (typically 2-5 vigour zones), and translating this into a prescription map for the operating machinery. The five most common applications in Italy today are as follows.
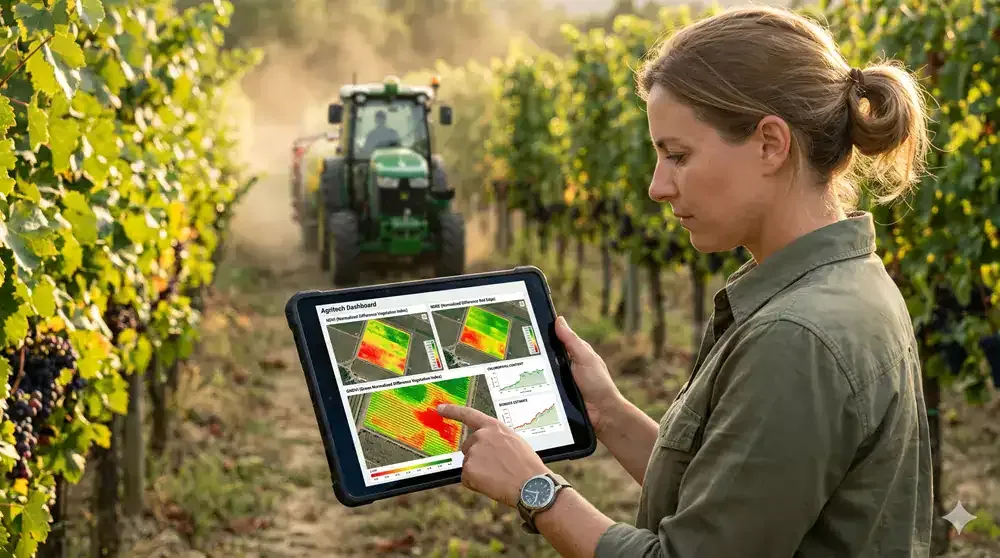
Fig.4: From map to action: reading NDVI, NDRE and GNDVI in the field means turning them into concrete crop management operations.
Differentiated fertilisation and variable-rate nitrogen
In arable crops and orchards, zoning based on NDVI or GNDVI makes it possible to distribute nitrogen in proportion to each zone’s actual needs. Various ISMEA analyses indicate nitrogen savings in the order of 10-20% on areas managed at variable rate, with reduced leaching and compliance benefits with respect to the 2023-2027 CAP eco-schemes and the Nitrates Directive.
Selective harvesting
In PDO and PGI supply chains, pre-harvest NDVI or NDRE maps make it possible to divide the vineyard into zones of different vegetative-productive balance and to harvest, separately, grapes destined for different product lines. On this topic, you can read more in the following article, which shows the advantages in a real case.
Targeted crop protection
Identifying localised anomalies (disease outbreaks, insect attacks, root problems) makes it possible to intervene only where needed. Combined with prescription maps and with spraying drones, selective crop protection can reduce pesticide use in line with the goals of the European Farm to Fork strategy and the Agri 4.0 National Recovery and Resilience Plan (PNRR).
Precision irrigation
Integrating CWSI maps from thermal flights, soil moisture probes and local weather stations makes it possible to build zonal irrigation plans. This is particularly relevant in regions facing growing climate stress.
Reporting for certified supply chains
Cooperatives and wine cooperatives use the historical archive of maps as technical documentation for PDO/PGI specifications, sustainability schemes (SQNPI, Equalitas, VIVA) and corporate sustainability reports, in line with the CSRD directive and the European Green Deal.
Frequently asked questions about vegetation indices
What is the difference between NDVI and NDRE?
NDVI uses the red band, NDRE the red edge band. The practical difference lies in sensitivity: NDVI saturates on dense canopies (LAI above 3), while NDRE retains internal variability even at an advanced stage of development. For cereals before heading, vineyards in full vegetation and mature orchards, NDRE is almost always more informative.
Which index is best for vineyards?
There is no single best index: in the early vegetative stages (up to flowering), NDVI is adequate; after fruit set, and especially pre-harvest, NDRE is preferable to avoid saturation. For controlled water stress, especially in premium supply chains, thermal-band CWSI is irreplaceable. In any case, it is always essential to remove soil and inter-row pixels before creating zoning and prescription maps, to avoid including pixels that are not part of the canopy alone, which would distort the final value and could even lead to false positives/negatives.
Can vegetation indices be calculated with a smartphone?
Yes, directly only for indices based on visible bands and with proprietary calibration algorithms. DSS apps such as iAgro generate vigour maps (LAI index) from RGB photos and also process indices from Sentinel-2 bands in the cloud. Resolution and accuracy are lower than with a multispectral drone survey, but the cost/benefit ratio is excellent for scouting and small-to-medium farms.
What does an NDVI of 0.7 mean?
It indicates a healthy crop with good leaf cover and high photosynthetic activity. The exact interpretation depends on species, phenological stage, geography and sensor: 0.7 in a vineyard in May means something different from 0.7 in a cereal crop in July. Credible comparisons are made between zones of the same farm on the same flight, not in absolute terms.
How often should an NDVI map be updated during the season?
For Sentinel-2 satellite monitoring, the natural cadence is 5 days, reduced by cloud cover. For drone surveys on high-value-added supply chains, at least 1-2 seasonal flights are recommended at key phenological stages (fruit set, veraison, pre-harvest), which can be increased to 6-8 in experimental or research settings.
What regulations incentivise the use of vegetation indices?
At European level, the Green Deal’s Farm to Fork strategy targets a 50% reduction in pesticides and a 20% reduction in fertilisers by 2030; in Italy, the 2023-2027 CAP, with reinforced conditionality and eco-schemes, rewards precision agriculture practices. The Agri 4.0 National Recovery and Resilience Plan (PNRR) and regional RDPs fund hardware, software and remote sensing services.
Want to turn vegetation indices into operational decisions?
Agrobit designs integrated remote sensing plans for your supply chain: multispectral and thermal drone surveys with iDrone, continuous monitoring via the iAgro app, integration with field sensors and management software. Talk to one of our technicians to build the right workflow for your business.
▶ Discover the iDrone service ▶ Read more on the Agrobit blog
For agronomists and field technicians, a dedicated training path on precision agriculture and photogrammetry is also available.