
Water stress and the CWSI index: a guide to precision irrigation
Water stress and the CWSI index: a guide to precision irrigation
Introduction
Crop water stress has become one of the main risks facing Italian agriculture: drought-hit rivers, heatwaves and dry winters in recent years have turned irrigation from a supplementary practice into a strategic lever for yield and quality. According to FAO and ISPRA data, water stress affects growing portions of Italian and European territory. Measuring water stress objectively, before it becomes visible damage, is now possible thanks to the CWSI index calculated from thermal images acquired by drone. This guide explains how it works, how to interpret it, when to fly, and how to integrate it with soil sensors and weather stations to build genuinely effective precision irrigation.
Water stress in crops: causes, physiology and impacts
Crop water stress is the physiological condition in which a plant cannot meet the transpiration demand imposed by the atmosphere with the water available in the soil. As vapour pressure deficit (VPD) increases and soil water becomes scarce, the stomata close, photosynthesis slows down, and leaf temperature rises: it is precisely this temperature increase, readable remotely, that forms the physical basis of the CWSI.
The causes of water stress are numerous: lower winter rainfall, increasingly frequent summer heatwaves, soils with low field capacity, and non-zoned irrigation systems. The impacts range from reduced yield to loss of fruit size, from altered sugar/acidity ratios in grapes to flower abortion in olive groves, up to the risk of permanent stress on young tree crops.
20-50%: Estimated potential water saving for businesses that adopt zoned precision irrigation systems compared with traditional uniform irrigation regimes, based on documented experience in Italian wine and fruit/vegetable supply chains (source: analysis based on FAO Aquastat data and ISPRA reports on water status).
Water stress in viticulture: positive or negative?
The vine is one of the few crops for which a certain degree of water stress is desired. A moderate controlled water deficit between veraison and harvest promotes the concentration of sugars, polyphenols and anthocyanins, contains vegetative vigour and improves the wine’s potential quality, particularly in structured red wines and in PDO wines with a strong sense of terroir.
The balance point is subtle, however: beyond a certain threshold, water stress becomes damage. Prolonged stomatal closure blocks photosynthesis, reduces ripening and risks having knock-on effects the following season. Measuring stress objectively, with CWSI or leaf water potential, allows the winegrower to stay within the “quality” window without exceeding the critical threshold.
Water stress in olive growing, fruit growing and vegetable growing
In olive growing, on the other hand, water stress should be minimised during sensitive stages such as flower bud formation, fruit set and fruit swelling: a deficit at these phenological stages produces fruit drop, reduced oil yield and smaller fruit size. In fruit growing (stone fruit, pome fruit, citrus) and vegetable growing, the link between water availability and fruit size/quality is even more direct, and CWSI maps guide zonal irrigation scheduling.
How water stress is measured: direct and indirect methods
Measuring water stress means quantifying the balance between water lost through transpiration and water available to the plant. There are direct methods, based on laboratory or field measurements of the plant and soil, and indirect methods, based on thermal and multispectral remote sensing. The two approaches are complementary: the former provide the ground-truth reference, the latter provide spatial coverage and frequency.
Direct methods: leaf water potential, tensiometers, TDR probes
Leaf water potential, measured with a Scholander pressure chamber, is considered the scientific gold standard for quantifying a plant’s water status: it is expressed in MPa (negative values) and has known thresholds by crop and phenological stage. It is accurate but requires experienced operators, and it is point-based and not very scalable across large areas.
Tensiometers and TDR (Time Domain Reflectometry) or capacitive probes, on the other hand, measure soil water availability at different depths. They allow continuous remote monitoring but represent a single point in the field rather than the plant’s actual physiological response. To overcome the limits of spatial representativeness, every farm should be covered by at least one probe per homogeneous zone (by soil type, exposure, variety).
Indirect methods: thermal and multispectral remote sensing
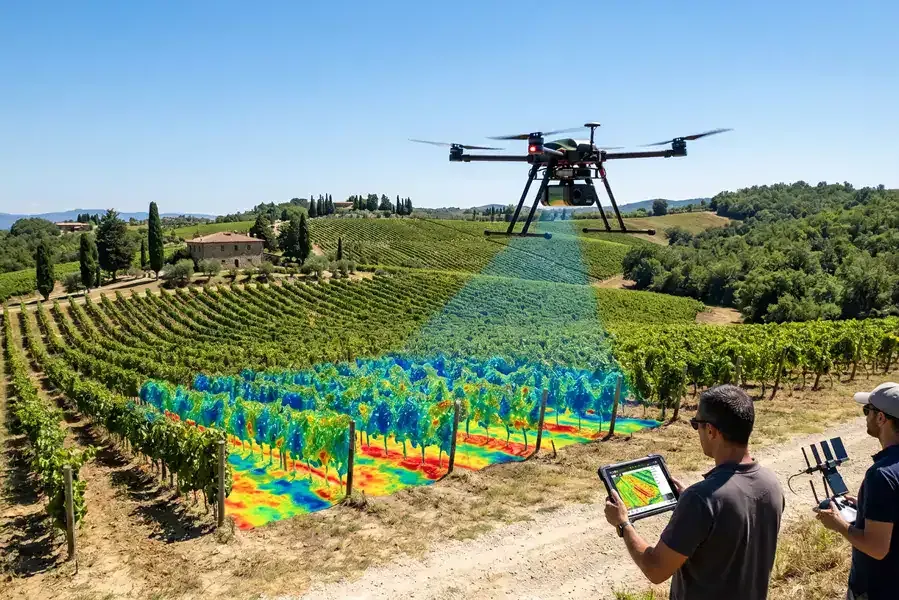
Remote sensing fills the spatial gap. Agricultural thermography by drone measures canopy temperature using long-wave IR sensors (8-14 µm) and, combined with weather data, feeds the CWSI calculation. In parallel, multispectral indices such as NDRE, OSAVI or the NIR/SWIR reflectance ratio provide complementary information on vegetative status and the canopy’s possible water content.
To learn more about acquisition platforms, it is worth reading the overview of drone sensors dedicated to agriculture, which describes the pros and cons of multispectral and thermal sensors across different seasons and phenological stages.
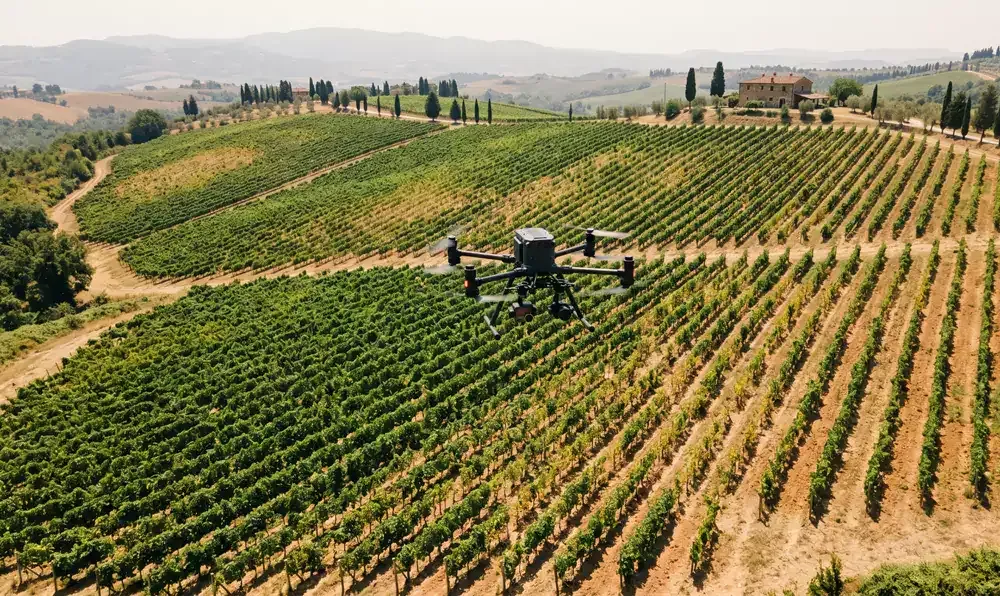
Fig.1: Thermal acquisition by drone in a vineyard: the optimal flight window is 11:00 a.m.-2:00 p.m. on sunny, stable days, a necessary condition for a reliable CWSI.
The CWSI index: definition, formula and operational thresholds
The CWSI index (Crop Water Stress Index) is a dimensionless index between 0 and 1 that measures a crop’s level of water stress by comparing canopy temperature with two theoretical references under the same atmospheric conditions: the temperature the same crop would have in the absence of stress (well irrigated), and the temperature it would have under maximum stress (stomata completely closed).
The physiological basis of the CWSI is simple: a well-hydrated plant transpires and, through evaporative cooling, keeps its canopy cooler than the air; under water shortage, the stomata close, transpiration drops and the canopy warms up. The Crop Water Stress Index normalises this temperature difference between two theoretical limits. In the formulation established in the literature (Idso’s empirical formulation and Jackson’s theoretical formulation, 1981), the index is written in normalised form as:
CWSI = (dT − dTLL) / (dTUL − dTLL)
where dT = Tc − Ta is the measured difference between canopy temperature (Tc, from a thermal camera) and air temperature (Ta), in °C. The two reference terms are:
- dTLL (lower limit, lower baseline): the Tc − Ta difference expected in a well-irrigated crop in full transpiration (non-water-stressed baseline). It is generally negative, since the canopy is cooler than the air, and depends on vapour pressure deficit (VPD).
- dTUL (upper limit, upper baseline): the difference expected in a completely stressed, non-transpiring crop, with closed stomata and a canopy warmer than the air; a positive value.
When dT coincides with the lower baseline, the index equals 0 (good water status); when it coincides with the upper baseline, it equals 1 (maximum stress). The lower baseline is typically modelled as a VPD line in the form dTLL = a − b · VPD, with coefficients a and b to be calibrated for species, variety and local climate. VPD (Vapour Pressure Deficit) is derived from the weather station, by simultaneously measuring air temperature and humidity.
Typical operational interpretation thresholds are:
- CWSI 0 – 0.2: good water status, well-irrigated crop, no intervention needed.
- CWSI 0.2 – 0.4: mild stress; in quality viticulture, this often falls within the controlled deficit irrigation (RDI) threshold sought between post-fruit-set and pre-veraison to contain vigour and improve grape quality.
- CWSI 0.4 – 0.6: moderate stress; irrigation intervention should be assessed for most crops (orchards, table olives).
- CWSI 0.6 – 0.8: severe stress, risk of reduced yield and quality: intervene.
- CWSI > 0.8: critical stress, physiological damage occurring.
The thresholds are indicative: they must be calibrated in the field for crop, phenological stage and production goal. Controlled deficit irrigation deliberately applies volumes below potential requirement at selected phenological stages, taking advantage of the vine’s tolerance to improve the skin/pulp ratio and the polyphenolic profile of the grapes.
The FAO-56 water balance: from CWSI to crop water requirement
CWSI indicates whether the crop is under stress at a given moment; to estimate how much water to apply, a water balance is needed. The international reference method is the crop coefficient approach described in the FAO Irrigation and Drainage Paper 56, which calculates crop evapotranspiration as:
ETc = Kc × ET0
where ETc is crop evapotranspiration (mm/day), i.e. the water actually lost by the soil-plant system; ET0 is reference evapotranspiration (mm/day), calculated using the FAO-56 Penman-Monteith equation on a standard reference grass surface, based on net radiation, temperature, humidity and wind speed; Kc is the crop coefficient (dimensionless), which adjusts ET0 according to species, phenological stage and canopy architecture. The farm’s weather station provides the inputs for ET0, while Kc marks the irrigation season by phenological stage.
Indicative Kc values for Mediterranean tree crops (FAO-56 and local adaptations, always to be calibrated for area and training system) are:
- Wine grapes (trellis system): bud break Kc ≈ 0.30-0.45; full vegetation/flowering Kc ≈ 0.70-0.80; veraison-ripening Kc ≈ 0.45-0.60.
- Olive: vegetative resumption Kc ≈ 0.55-0.65; flowering-fruit set up to ≈ 0.65-0.70; fruit growth/ripening Kc ≈ 0.50-0.65, reduced under dry-farming regimes.
The intersection between the theoretical balance (ETc) and physiological data (CWSI) is at the heart of the method: if the CWSI signals stress while the balance shows equilibrium, this is a sign that the adopted Kc needs updating, or that the irrigation system is distributing water unevenly.
When to fly a thermal drone
CWSI quality depends critically on the conditions under which the thermal data is acquired. The optimal window is 11:00 a.m.-2:00 p.m., on sunny, stable and calm days, ideally with clear skies for at least 30-60 minutes before the flight. Under these conditions, the difference between a well-irrigated canopy and a stressed canopy reaches maximum thermal contrast, and the CWSI calculation is reliable.
Flights should be avoided on cloudy days or with variable cloud cover (the canopy cools unevenly), in strong wind (turbulence affecting canopy temperatures), or during dawn/dusk hours (temperature differences too low). Recent rainfall or irrigation also affects the data for several hours.
The operational protocol requires measuring air temperature and VPD at the same time as the flight, using the local weather station: without these parameters, it is not possible to correctly set the dTLL and dTUL baselines, and the CWSI remains qualitatively readable but quantitatively unreliable. Standardising acquisition conditions (solar noon, clear sky, constant irradiance, light wind) is what makes a farm’s water stress maps comparable over time.
11:00 a.m.-2:00 p.m.: Recommended time window for thermal flights aimed at calculating CWSI under Mediterranean conditions: maximum thermal contrast between well-irrigated and stressed canopy, clear sky and high VPD.
From thermal map to irrigation plan
A CWSI map only has value if it becomes an irrigation plan. The standard operational workflow involves five steps: flight planning, thermal and reference RGB acquisition, mosaic processing and CWSI calculation, zoning into homogeneous classes, and translation into an irrigation plan or a prescription map for zoned micro-irrigation systems. This is a process that integrates agronomy, computer vision and irrigation engineering.
Zoning and intervention classes
Zoning divides the CWSI map into 2-5 homogeneous zones by stress level. Each zone receives a consistent operational recommendation: no intervention where CWSI is low, standard irrigation in medium zones, reinforced or earlier irrigation where CWSI is high. On many plots, the map also reveals soil or depth differences that guide future redesign of the irrigation system.
Compatibility with zoned micro-irrigation systems
Precision irrigation translates into action through systems compatible with spatial data. Sector-based drip irrigation, adjustable sprinkler lines and variable-flow drip tape are the most mature technologies for applying a zonal irrigation plan. Automation systems connected to weather stations and DSS close the loop, adjusting volumes and schedules according to the most recent CWSI map.
Use cases: vineyard, olive grove, orchard, vegetable crops
The operational applications of CWSI are wide-ranging. In DOC/DOCG vineyards, it guides controlled deficit management. In high-density olive groves, it identifies the zones where younger plants or those on light soils suffer first. In stone fruit and pome fruit orchards, it helps preserve fruit size during the growth stage. In vegetable crops and industrial crops (maize, processing tomatoes), it supports seasonal irrigation choices.
Thermal and multispectral surveys from the iDrone service include CWSI calculation as part of integrated agronomic analysis packages for high-value-added supply chains. Real examples are described in Agrobit’s case studies dedicated to maps and models to support winegrowers and maps and models to support olive growers.
Integration with soil sensors and weather stations
Drone-based CWSI captures stress at a single moment; to schedule irrigation over time, continuous field data is needed. The winning combination is the drone + soil probes + weather station triad, fed into a DSS that reconciles the three sources and suggests volumes and schedules.
Soil moisture probes
Multi-level capacitive probes or TDR probes measure moisture at different depths (typically 20, 40, 60 cm) and show in real time where irrigation water “goes down” to. They are the perfect complement to CWSI: the drone map shows where stress is occurring, while the probes show whether the soil is genuinely in deficit or whether the root system is failing to absorb water despite it being available.
Physical and virtual weather stations
The weather station provides the parameters (temperature, humidity, radiation, rainfall, wind) needed to estimate reference evapotranspiration (ETo) and VPD. High-resolution virtual weather stations integrate numerical models and satellite data when a physical station is not available on the farm. Potential evapotranspiration is the backbone of any crop water balance model.
DSS and water balance models
An irrigation DSS aggregates the three data sources and calculates the residual crop water requirement. The typical model is based on the FAO-56 equation (ETc = ETo × Kc), corrected with real data from the probes and constrained by CWSI: if the CWSI indicates “stress occurring” even when the theoretical balance is in equilibrium, this is a sign that the model needs to be updated with a new Kc, or that the irrigation system has uneven distribution. The iAgro app integrates hyperlocal weather forecasts, satellite indices (NDMI, another spectral index used to monitor water stress) and crop models to support these decisions at farm level.
Operational case: controlled water deficit in a vineyard
A 25-hectare Tuscan winery growing PDO Sangiovese has been running a CWSI-based protocol for several seasons. The operational logic is as follows: two seasonal thermal surveys (one post-fruit-set, one post-veraison) generate two stress maps used to calibrate irrigation management. The goal is not to “eliminate stress” but to keep it within a target quality window (CWSI 0.2-0.4) between veraison and harvest, while still safeguarding the most sensitive areas (sandy soils, warmer exposures).
The maps reveal significant differences between areas of the plot: areas on deep soils with low CWSI remain under a “no irrigation” regime, while areas on light soils with a less developed root system receive targeted interventions. Various analyses of the Italian agricultural sector indicate that combining thermal remote sensing, field probes and DSS can reduce the vineyard’s overall water consumption for the same potential quality; in premium viticulture, the goal is not just to save water but to distribute it better.
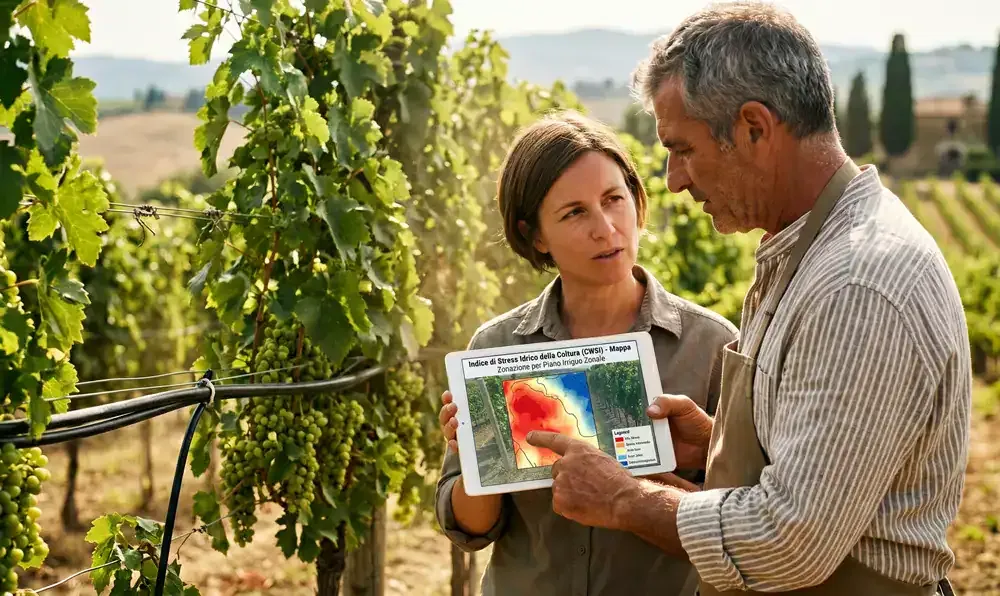
Fig.2: From CWSI map to irrigation plan: the winegrower and agronomist decide in the field where to reinforce drip irrigation schedules based on stressed zones, while preserving the quality deficit in others.
Compliance with eco-schemes and grant programmes
Adopting precision irrigation practices is consistent with the objectives of the 2023-2027 CAP (eco-schemes on sustainable resource use), the European Green Deal and the Farm to Fork strategy on input reduction. The Agri 4.0 National Recovery and Resilience Plan (PNRR) and regional grant programmes (RDP/CSR, ERDF) fund sensors, drones, DSS software and training, making a CWSI protocol accessible even to small and medium-sized businesses. More information on grants and funding for digital agriculture is available on the Agrobit blog.
Frequently asked questions about water stress and CWSI
What is the CWSI index?
CWSI (Crop Water Stress Index) is a dimensionless index between 0 (no stress) and 1 (maximum stress) that measures a crop’s water stress by comparing canopy temperature with air temperature and with theoretical references for a well-irrigated and a completely stressed crop under the same atmospheric conditions.
How is water stress detected in a vine?
It is detected using three complementary approaches: direct measurements (leaf water potential with a Scholander pressure chamber, tensiometers or soil moisture probes), thermal remote sensing (drone-based CWSI maps) and multispectral remote sensing (NDRE, OSAVI). Integrating spatial data (drone) with continuous data (probes) is the most robust operational model.
Can water stress be seen from satellite?
Yes, partially. The Sentinel-3 satellite and other thermal sensors provide surface temperature maps, but with a resolution of hundreds of metres, unsuitable for row-scale analysis. The Sentinel-2 satellite, in the SWIR band and with indices such as NDWI, provides indirect indications. For calculating a row-scale CWSI, a thermal drone remains the reference tool.
When is the best time for a thermal flight?
The optimal window is 11:00 a.m.-2:00 p.m. solar time, on sunny, stable days with clear skies for at least 30-60 minutes before the flight. Variable skies, strong wind, extreme time slots (dawn and dusk), and flights close to recent rainfall or irrigation should all be avoided.
Is controlled water stress good for wine?
A moderate water deficit between veraison and harvest can improve the potential quality of structured red wines: it increases the concentration of sugars, polyphenols and anthocyanins, contains vegetative vigour, and improves the sensory profile. The quality window is subtle, however: beyond the threshold, it becomes damage. Measuring with CWSI makes it possible to stay within the right window.
How much can be saved with precision irrigation?
Documented experience in Italian supply chains indicates water savings in the order of 20-50% compared with traditional uniform irrigation regimes, depending on the crop, soil type and starting irrigation system. The saving is accompanied by better water distribution and better quality control of production.
Conclusions
Agrobit designs integrated CWSI protocols for vineyards, olive groves, orchards and arable crops: thermal drone surveys with iDrone, integration with field probes and weather stations, and agronomic support in reading the maps and scheduling irrigation. Talk to one of our technicians to build the right workflow for your supply chain.
▶ Discover the iDrone service ▶ See field sensors and weather stations
For businesses looking for an end-to-end operational path, the tools for farms page is available, along with more information on the sustainability of Agrobit’s technologies.